We have assembled several contigs from SOLEXA reads (size ranges from 200bp to 20kb), now I want to map onto a closely related reference genome. Is there a good program? I tried Blast and mauve. Blast gives good results, but I just need something that can be used to visualize.
You found that Blast gives good results so you are done with that part. To visualize the alignment use something like GBrowse, IGV, or maybe IGB. Or print out the alignents in your own HTML.
No need to look for a different aligner if you don't have a visualizer.
Alek already mentioned GBrowse and IGV as the visualization tool. You'll want your reference genome to be the one you compare to. Let me just add that you need to convert your BLAST result into a format that the tools can accept. BED format is a good start. You need to have a few columns in this file format (the first three are mandatory).
chrom, start, end, name, score, ...
If you have a BLAST tabular format, these fields are already present in the results.
queryId, subjectId, percIdentity, alnLength, mismatchCount, \
gapOpenCount, queryStart, queryEnd, subjectStart, subjectEnd, eVal, bitScore
To convert to BED format, assuming query is your contigs and subject is the referece:
subjectID, subjectStart - 1, subjectEnd, queryID:queryStart-queryEnd
You might need to swap subjectStart and subjectEnd, depending on which one is larger. Also note in the final BED file, use tab instead of comma.
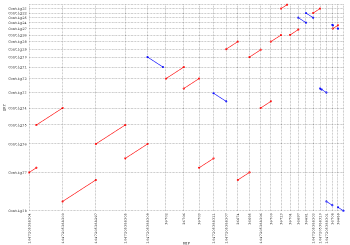
I always found another tool, MUMMERPLOT to be quite useful - if you can use a different aligner (MUMMER). I always do MUMMERPLOT after assembly.

You could also try CONTIGuator, which uses blastn internally to map contigs to a reference genome: it then produces a series of maps (one for each reference replicon) viewable with the ACT tool from the Sanger institute. The upcoming version will also prepare a series of pdf maps.
Use of this site constitutes acceptance of our User Agreement and Privacy Policy.


Please fix title "contains" to "contigs".
@Aleksandr, done.