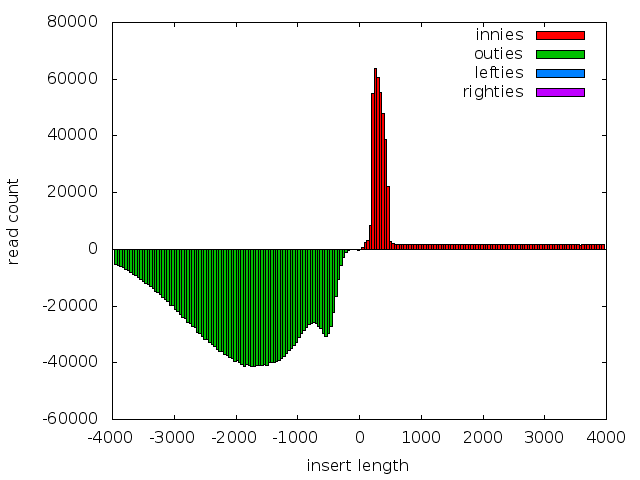
I want to visualise insert sizes in my mate-pair library and calculate statistics like mean, standard deviation..
I have found this tool http://blog.malde.org/posts/bamstats.html that makes beautiful graphs like the one above (the plot shows mate pair library - green - contaminated by paired end reads in red).
However, based on output of this program it seems that there are plenty of paired-end reads in my library and only few mate-pairs (orientation outwards, outies on the plot). I want to verify this with another tool. Picard's CollectInsertSizeMetrics works only for paired-end reads according to manual. What are other possibilities?
Moreover, I got pretty wild statistics from bamstats package, probably because of outliers in my data:
#Alignment             count       prop       mean      stdev       skew       kurt
innies                11853    33.53%    861169.9    8776007.0       12.2      161.7
outies                 4560    12.90%    2644111.4    15288468.3        6.7       46.7
lefties                4681    13.24%    2769622.5    16057397.2        6.4       42.8
righties               4585    12.97%    3128289.8    17007034.4        6.2       39.5
Any suggestions are welcome. I need three things: estimated mean (after removal of outliers), standard deviation (again after removal of outliers) and visualisation. Both, histograms and boxplots work for me.
Thanks a lot!


Did you figure out how to install this? Please let me know if you get this thing working.
Thanks,