Alternative microarray analysis
1
0
Entering edit mode
9.9 years ago
alisce84 • 0

I am analyzing 20 Agilent microarrays from humans (20 subjects, two conditions) and yet there is no differentially expressed gene after adjusting for multiple testing (BH). I used Limma in R, tried different background correction as well as normalization methods (within and between arrays), I also tried to remove the least expressed probes to try to boost the signal. All the array quality checks looked fine.

The question is, if there are no significantly differentially expressed genes, what can be done? Has anyone ever tried to get some results out of this situation or has a good paper/link to suggest?

Thanks all!

microarray Limma R • 3.0k views
ADD COMMENT
0
Entering edit mode

How is the correlation between biological replicates ?

ADD REPLY
0
Entering edit mode

There are no biological replicates, let's say I have condition A on 10 subjects and condition B on the other 10

ADD REPLY
0
Entering edit mode

you can always look at the fold change values.

ADD REPLY
0
Entering edit mode

but they need to be significant, no?

ADD REPLY
0
Entering edit mode

Variance would be very high within the groups thats why you do not get significant DEGs between the groups, so better to try out as I suggested in the answer below,

lets see what happens then.

ADD REPLY
2
Entering edit mode
9.9 years ago
Manvendra Singh ★ 2.2k

Sometimes, It happens with large cohort of samples.

best to look into row-wise z-scores to see the sample wise alterations in gene expressions.

or

you have normalized expression values for each sample, you can take a row wise mean and calculate relative expression value for each gene in each sample, calculate spearman's correlation between the samples, cluster them and see how controls and cases are clustering.

if there are both controls and cases in single cluster then thats the reason of high variance within the group when you calculate DEGs.

better would be to consider only those clusters which contain either cases or controls, and make DEG analysis via limma by grouping them independently.

and then after may be to compare each cluster with each cluster and see overlapping or unique genes and so on you can play with data.

hth

ADD COMMENT
0
Entering edit mode

Thank you for your suggestion, but I don't understand the procedure, although I got the concept.

What do you mean to calculate relative expression value for each gene, maybe to subtract the row wise mean from the gene expression value? Guess in this case we're talking about A values and not M values. Also, do you mean computing Spearman correlation between each couple of subjects? And then use all (above 40.000) probes to cluster subjects or just a sample?

ADD REPLY
1
Entering edit mode

Do not substract, just divide

e.g. Suppose if you have a dataframe (df) where row.names are genes and col.names are samples then in R

######## load some libraries
library(plyr)
library(limma)
library(genefilter)

###### if data is not properly normalized
df=normalizeQuantiles(df, ties=TRUE)

###### calculate row mean
mean=apply(df, 1, mean)

###### relative expression
df.rel=df/mean
cor=cor(df.rel, method="spearman")

##### draw a dendrogram to see how it looks like

############################ more efficient way is to select top genes which shows more std.deviation within  ###  dataframe

percentage<-c(0.900) ###### selecting 0.1%
 sds<-rowSds(df) ######## calculating std.deviation
 sel<-(sds>quantile(sds,percentage)) ##### top deviating genes
 set<-df[sel, ] ###### assigning to new set

####### clustering
 distmeth<-c("euclidian")
 D<-dist(t(set), method=distmeth)
 treemeth<-c("average")
 hc<-hclust(D, method=treemeth)
 plot(hc)

####### see how it looks like

####### or you have your new dataframe named as "set" you can make heatmap cluster them with spearman's correlation or again calculate relative enrichment and see how many major clusters you are getting in your dataframe

HTH

ADD REPLY
0
Entering edit mode

Thank you very much for your help.

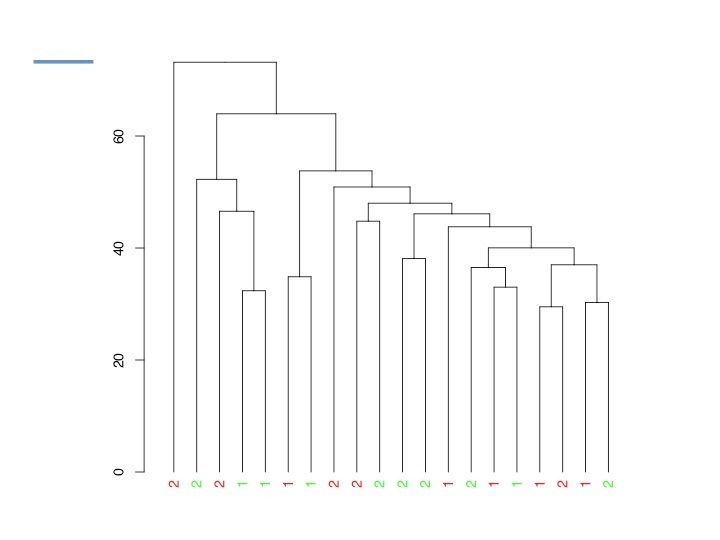
See the dendrogram, where the color represents control and case, while the numbers 1 and 2 represents the two different batches. The arrays where done in two tranches at different times, but I corrected for this in with Combat. I also tried not using combat and just including the batch as a variable in the model (same result).

I also tried to double the sample size (copied control and cases, so I get twice the arrays) just to see if the low p.values were due to sample size. And in fact I get significant adjusted p values this way, and the significant probes overlap the top ones of the standard analysis. This showing that the problem relies in the small sample size.

But still I don't know how to deal with this - of IF there is something to do about it.

Following your suggestion and analyzing only clusters with either control or cases, well, there aren't any, as control and cases are spread out so homogeneously.

ADD REPLY

Login before adding your answer.

Traffic: 1965 users visited in the last hour
Help About
FAQ
Access RSS
API
Stats

Use of this site constitutes acceptance of our User Agreement and Privacy Policy.

Powered by the version 2.3.6