This is for an project which gathers data.
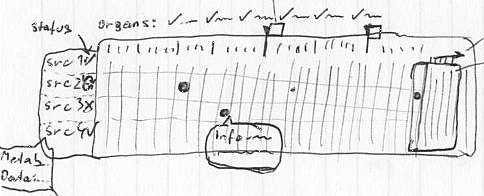
I am starting out with a sketch. The idea is to visualize heterogeneous data, which is requested from various data providers (src1...) upon a specific request (e.g. a molecule).
In a table / matrix I then visualize if the data is available and matches to a category on the X-axis. Upon clicking on one of these categories it slides open and reveals subcategories.
Which 'applet' do you know of, that comes closest to the sketch along with the description?
Have you seen something similar somewhere? Do you know of any good scripts?
Any input is appreciated...
Upd: Thanks. Some nice viz I have seen so far:
(resources) http://webapps.stackexchange.com/questions/8669/how-to-visualize-data-online
http://informatics.systemsbiology.net/visualizations/heatmap/bioheatmap.html based on http://code.google.com/apis/chart/
http://www.tableausoftware.com comprehensive, but dated (server-renders a new image and serves it to the client).


nice, very nice.