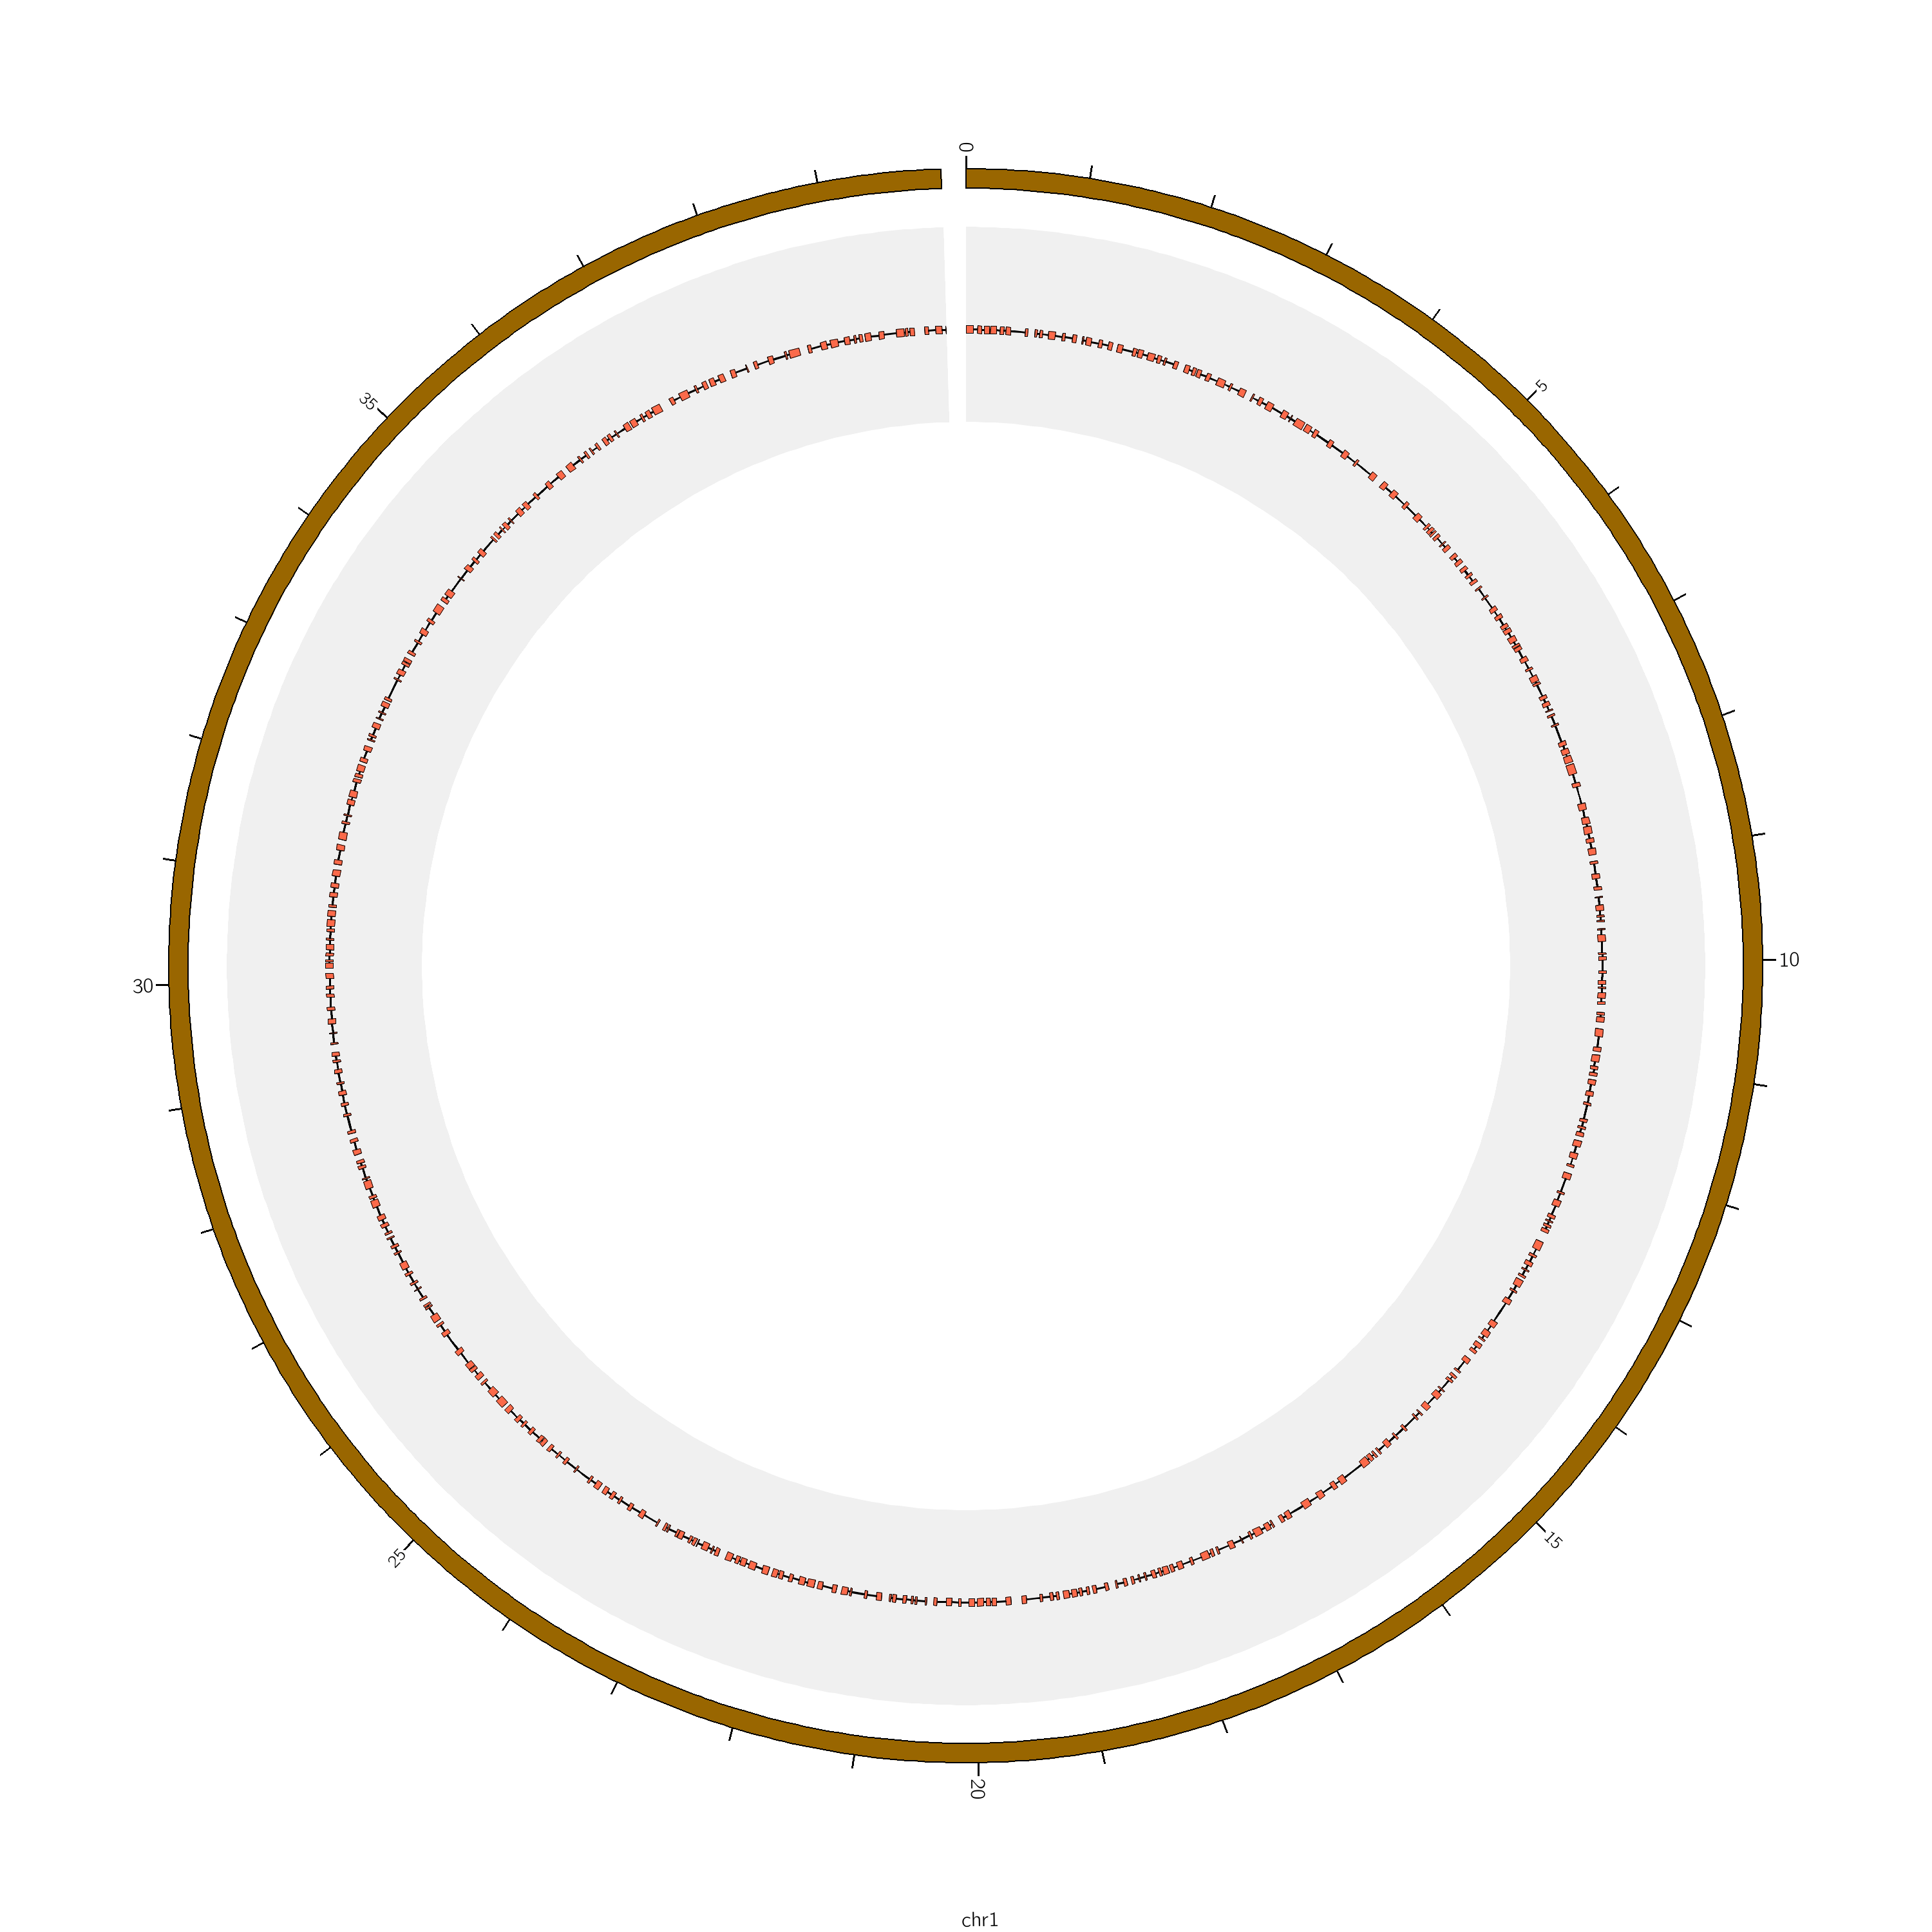
I want to make a circos plot of a small genomic region and would like to draw the transcripts in that region as thick exons connected by thin introns. I have looked at using tiles, but it does not seem that I can control how related tiles are drawn with respect to each other. Has anyone else successfully drawn transcript models with circos?
I have looked at using ggbio to do something similar, but ggbio does not yet offer different scaling in different parts of the plot; circos does this well.


I would be interested in this also. The learning curve for Circos is tough, but I'm pulling through it. Just getting the dependencies working was rough enough.
Do you have a good example from a paper I could try to dissect? A citation for a paper with a figure you want to try to emulate or do something similar would be great. There are numerous examples from the tutorial files and the Circos Google Group is also a good place to check.
I didn't see an example in the tutorials that matched my needs. I want a UCSC browser view, but in circos, basically.