
I'm using ChIPQC_1.10.3,/DiffBind_2.2.12 and deeptools 2.5. Basically the idea of this question, is to try to reproduce almost the same pca plot with the two tools.
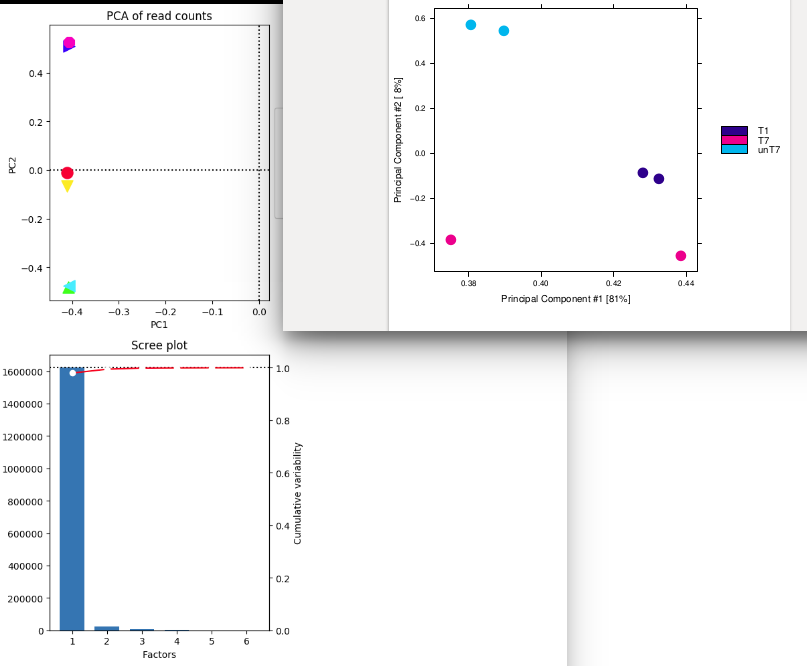
On the right , I have done the pca plot with ChIPQC : I have used consensus mode with 250 bp around peaks. I think that I used 275 777 regions where at least a peak was called for a mark. I retrieved these regions from ChipQC. (sum of all regions found with peaks for all my different marks to use with deeptools pca). I think ChIPQ do a log2 transformation on the raw count.
ChIPQCreport(..)
The samples seems to be separated by condition/color (T1,T7,unT7) but PC2 is low compared to PC1. Pink one seems to have a strange behavior... Is PC2 the effect of the treatment and PC1 "genomic effect" ?
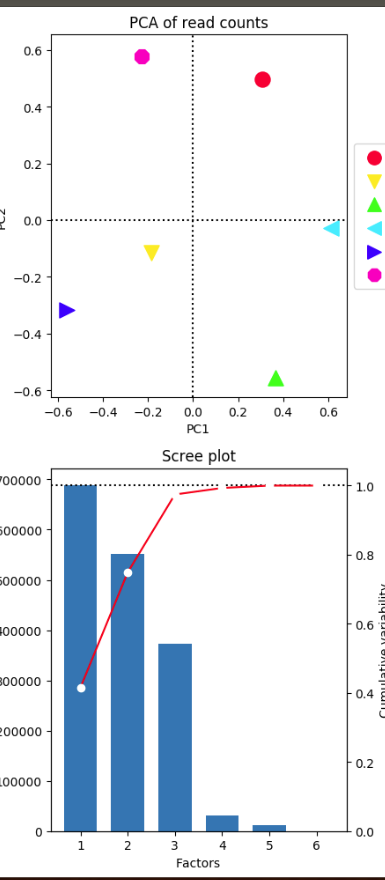
On the left I have use these 275 777 regions that I suspect to be use by ChIPQC with deeptools.
multiBamSummary BED-file --BED regions.bed --ignoreDuplicates  ...
plotPCA ...
The samples merged well by condition. I don't understand why the PC1 is very high but all the samples are aligned on a vertical axis ! Is this a bug ? here How can you explain that ?
Also pink point that were disjoined in previous chipqc plot seems to be perfectly match now ! Is this a display effect ?
Does deeptools also transform the raw count in log2 ?
Devon Ryan said "the size of the effect accounted for by a PC doesn't tell you anything about how informative that will be in discriminating between samples...The size of an effect is telling you about how much it contributes to the variation inside a sample. In ChIPseq that tends to be dominated by genomic position, since you'll have things like GC bias or other random library-prep. artefacts that are common between samples" here][2]
Sorry but I'don't understand how you interpret the degree of PC.
Why your argument on genomic position is more valuable for ChipSeq than RnaSeq ? If you are looking at the same histone mark between samples with different treatment, it should not play a strong role ?
Update :
Also what is the impact of --rowCenter because it totally changes PC, and plot ;-/

I am not sure I understand the question here. What is the purpose of using two different tools to generate the same figure ? Presumably, the tools are different because they do something different to the data. My impression is that you also don't understand what PCA is so I would suggest you start from there.