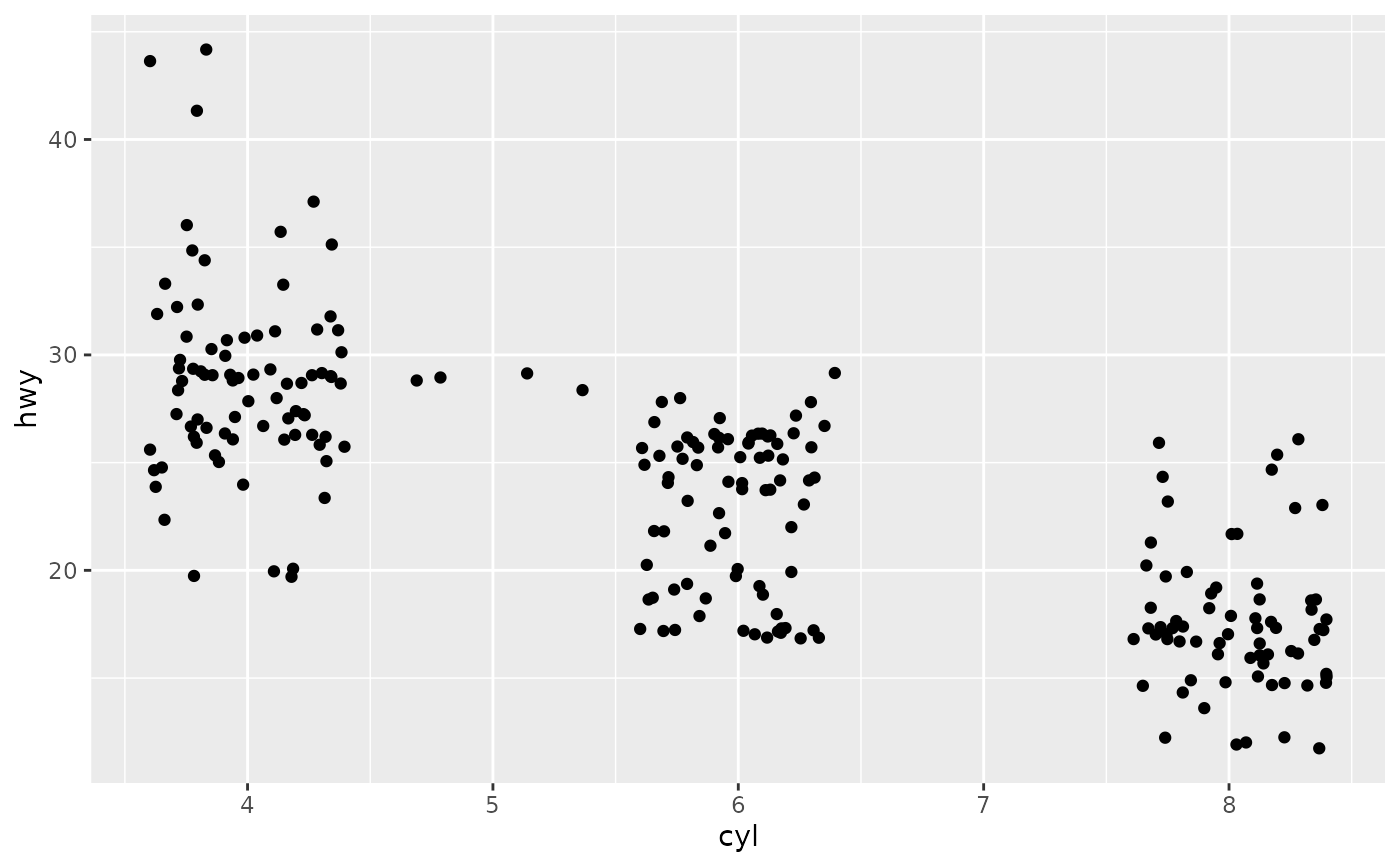
Does anyone know the R or python package used to produce an image as given below. I would like to plot tumor frequency models. Thanks
1
Entering edit mode
7.6 years ago
Mike
★
1.9k
Have a look at following packages...
GenVisR (parameter mutBurden)
https://bioconductor.org/packages/devel/bioc/vignettes/GenVisR/inst/doc/GenVisR_intro.html
maftools
https://bioconductor.org/packages/devel/bioc/vignettes/maftools/inst/doc/maftools.html
How to create a mutation landscape (waterfall) plot with GenVisR
0
Entering edit mode
7.6 years ago
igor
13k
I don't know if there is a package for that, but you can use ggplot geom_jitter to do something similar. It's not the same, but it will let you see the distribution of the individual values.

Similar Posts
Error! readyState=0 status=error text=
Loading Similar Posts
Traffic: 2429 users visited in the last hour
Use of this site constitutes acceptance of our User Agreement and Privacy Policy.

