Plotting TSS & TTS for Chip-seq peaks
3
0
Entering edit mode
7.1 years ago
anu014 ▴ 190

Hello Biostars,

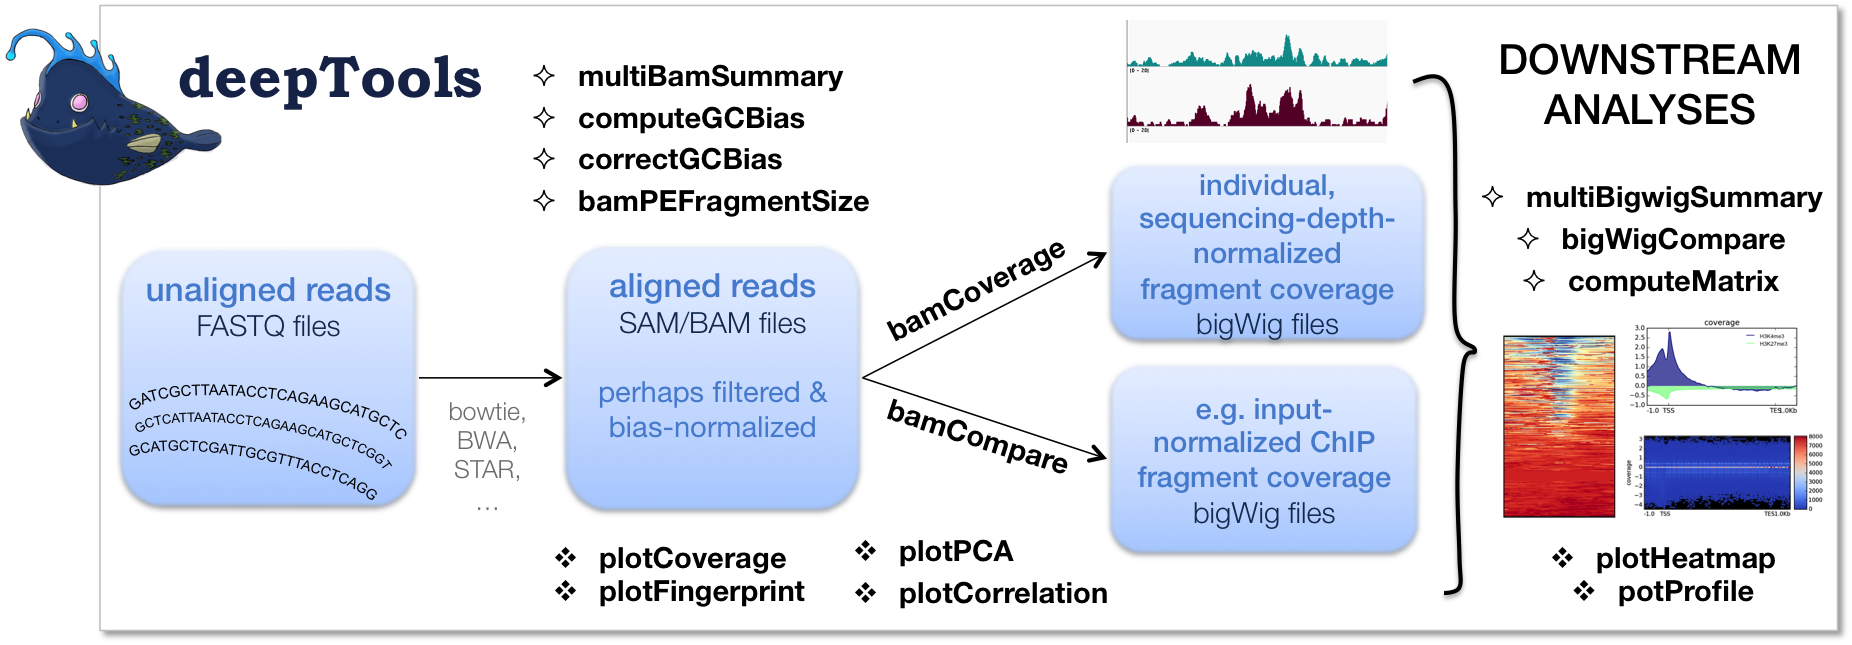
I need a graph showing the distribution of peaks near TSS and transcription termination site (TTS). Can anyone tell me any package/concept for it? I have tried ChIPseeker for TSS plot but I don't know how to plot TTS plot..

Please help me out. Thank you :)

ChIP-Seq plot next-gen • 6.0k views
ADD COMMENT
1
Entering edit mode
7.1 years ago
michael.ante ★ 3.9k

Hi Anu014,

You can have a look at the HTSeq case (a TSS tutorial): http://htseq.readthedocs.io/en/release_0.9.1/tss.html It should be easily adaptable for TTS as well.

Cheers,

Michael

ADD COMMENT
0
Entering edit mode
7.1 years ago

Alternative you could just calculate and visualise the distances yourself. The distances can easily be found with GenomicRanges in R.

ADD COMMENT

Login before adding your answer.

Traffic: 1995 users visited in the last hour
Help About
FAQ
Access RSS
API
Stats

Use of this site constitutes acceptance of our User Agreement and Privacy Policy.

Powered by the version 2.3.6