Get trace data for all four bases from ab1 file
2
1
Entering edit mode
6.9 years ago
st.ph.n ★ 2.7k

I'm wondering if anyone knows how I can get the trace data for each base, formatted into a text file. I've tried EMBOSS abiview and Biopython to retrieve these data. EMBOSS generates four file, such as suggested here, but the values don't seem to correlate to the chromatogram and trace values such as in the image. Biopython works to retrieve the data as dictionaries, but the in the dictionary abif_raw, the keys DATA9-12 are missing.

Chromatogram example with trace values:

https://ibb.co/dmpMMm

ab1 sanger trace chromatogram • 5.4k views
ADD COMMENT
6
Entering edit mode
6.9 years ago
trausch ★ 1.9k

Tracy can do this.

./tracy basecall -f tsv -o <out.tsv> <trace.ab1>

The tab-delimited output file lists the trace with the basecalls.

There is also an online method to visualize the trace on GEAR.

ADD COMMENT
0
Entering edit mode

This is great, @trausch. I was able to create the outputs, and it appears the .tsv file is what I'm looking for. I tested with one .ab1 file, which has a length of 434 bp, however there are 10,495 lines in the .tsv file.

Here's the first lines of the .tsv:

pos     peakA   peakC   peakG   peakT   basenum primary secondary       consensus       qual
1       879     0       966     29      NA      NA      NA      NA      NA
2       874     0       971     29      NA      NA      NA      NA      NA
3       859     0       976     33      NA      NA      NA      NA      NA
4       830     2       980     43      1       G       G       G       8
5       782     4       980     62      NA      NA      NA      NA      NA
6       715     4       972     93      NA      NA      NA      NA      NA
7       646     2       955     131     NA      NA      NA      NA      NA
8       589     0       931     167     NA      NA      NA      NA      NA
9       549     0       909     197     NA      NA      NA      NA      NA
10      517     1       892     216     NA      NA      NA      NA      NA
11      484     18      882     224     NA      NA      NA      NA      NA
12      445     47      880     219     NA      NA      NA      NA      NA
13      404     83      884     201     NA      NA      NA      NA      NA
14      365     119     890     175     NA      NA      NA      NA      NA
15      335     147     893     147     2       G       G       G       3

If I use GUI software to compare the calls per position, I can see that multiple lines in the .tsv belong to position one in the chromatogram view.

ADD REPLY
1
Entering edit mode

If you look at the basenum column it should go from 1 to 434. The trace is longer, all called peaks have a basenum value. In the GUI the x-ticks correspond to the basecall positions.

ADD REPLY
1
Entering edit mode
6.8 years ago
sacha ★ 2.4k

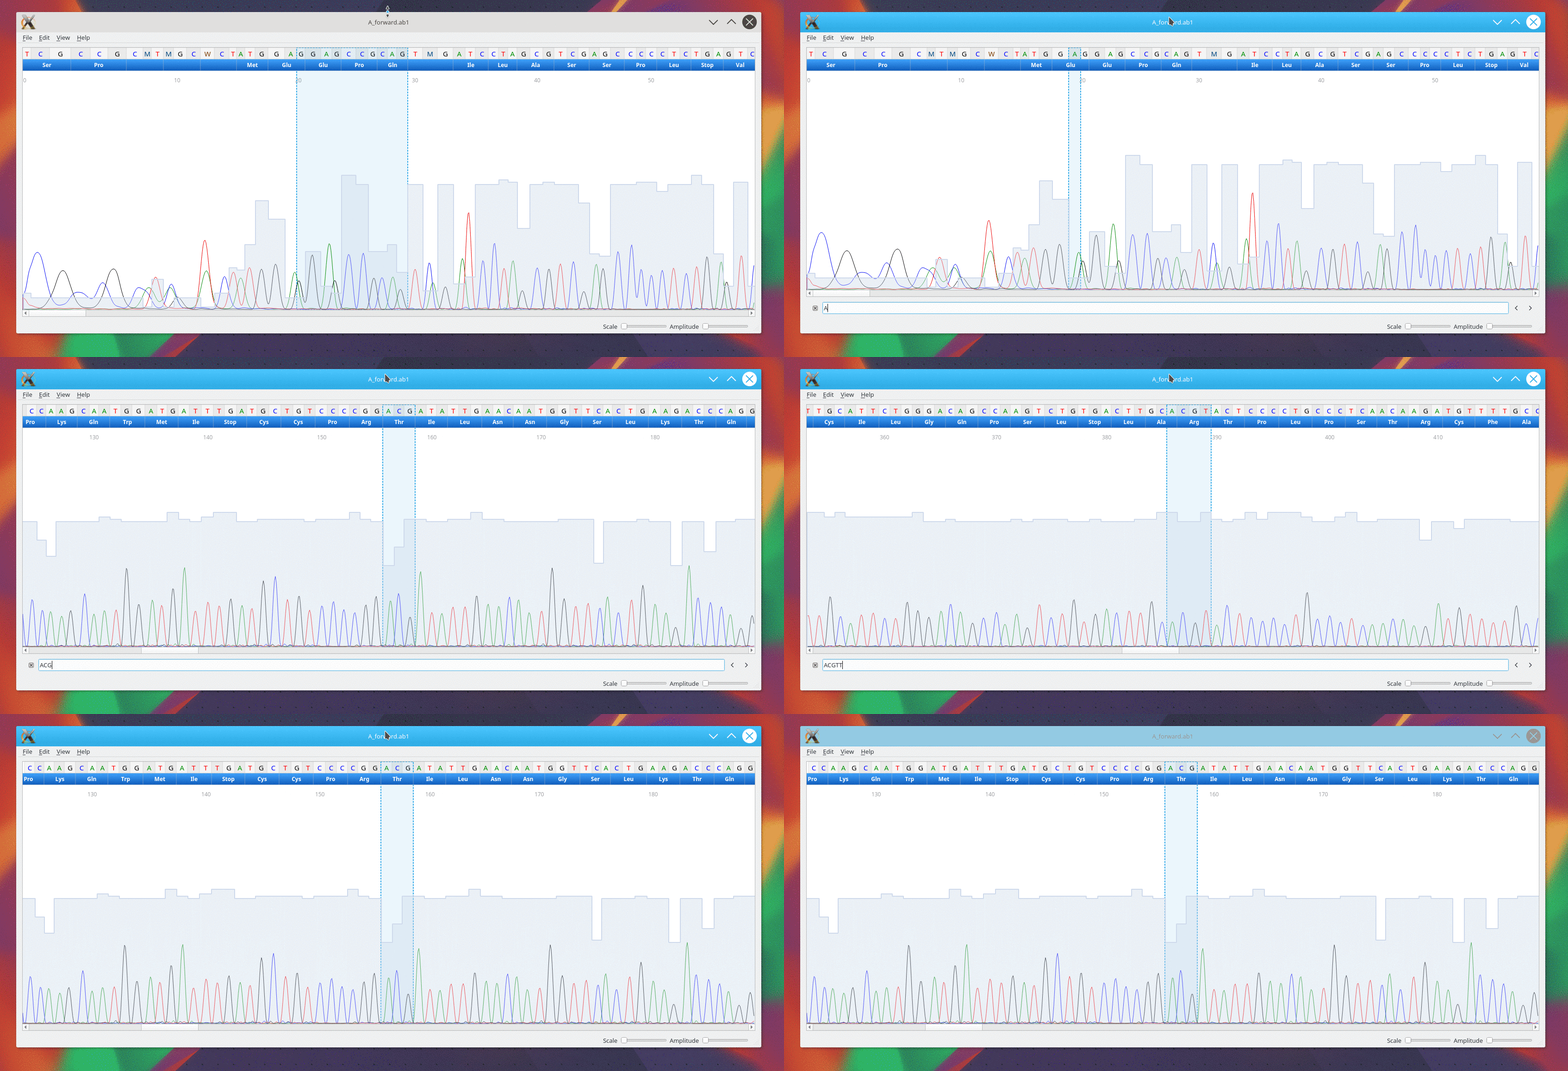
You can also test cutepeaks, a free gui software : https://github.com/labsquare/CutePeaks.

# Download the latest binary for linux
wget https://github.com/labsquare/CutePeaks/releases/download/0.2.0/cutepeaks-0.2.0-linux-x86_64.appimage

#  make it executable 
chmod +x cutepeaks-0.2.0-linux-x86_64.appimage

# Run the gui  
./cutepeaks-0.2.0-linux-x86_64.appimage

 # You can also extract data from command line 
./cutepeaks-0.2.0-linux-x86_64.appimage examples/A_forward.ab1 --tsv

If something is wrong, please fill an issue ! Thanks !

cutepeaks preview

ADD COMMENT

Login before adding your answer.

Traffic: 2737 users visited in the last hour
Help About
FAQ
Access RSS
API
Stats

Use of this site constitutes acceptance of our User Agreement and Privacy Policy.

Powered by the version 2.3.6