Hi,
I would like to normalize my amplicon sequencing data from a metagenomics study. I have looked into RNAseq and 16S normalization methods and I'm looking more closely now at TMM and DESeq. The problem is two-fold: 1) I am not familiar with RNAseq or 16S analysis...I have never done either. I've read papers ( Li P et al, Evans et al, Li et al, and Risso et al), but I'm uncomfortable just "winging it". So my first question is: does anyone have suggestions I should keep in mind since I'm normalizing amplicon sequencing data that's not 16S (and I'm not working with RNAseq data)?
2) The data I have been provided with is not count data, I have mean depth and coverage for each gene and each sample. So I need some kind of normalization that can be applied to this level of data. Maybe that won't be ideal; that's ok I can use that as a first-pass and get count data as soon as I can. After normalization, I will need to produce a heatmap to visualize the results. I'm hoping to get some expert advice that I can combine with what I've gleaned from the literature.
Thank you all for your advice.
Sample data format:
obsID   geneID  averageDepth    coverage
1   oqxA    252.6   1.00
2   erm(X)  1069.2  0.95
3   blaSHV  451.8   0.95
4   aph(6)  357.3   0.93
5   aph(3'')    92.6    0.75
6   dfrA17  48.6    0.74
7   mph(A)  16.4    0.73
8   blaTEM  950.2   0.68
9   strA    3075.4  0.65
10  erm(G)  18.5    0.63
averageDepth obtained from the sum of the per-base depth provided by Samtools divided by the length of reference coverage is number of bases with non-zero coverage divided by number of bases in reference


Working with the data should not be difficult, if not just a little unconventional. To help others, can you please just paste a sample of your data as it currently is (after you paste it, highlight it and then hit the
101 010button)? Some of our brains work better by visualising data in its current structure as opposed to reading a textual description of it. Thanks, KevinThanks, Kevin, that is a good suggestion! I've added some sample data (actual numbers, but it's just a random sample of n=10 from each column of my data). I also defined how mean depth and coverage for this data because it seems that there are many different interpretations of both.
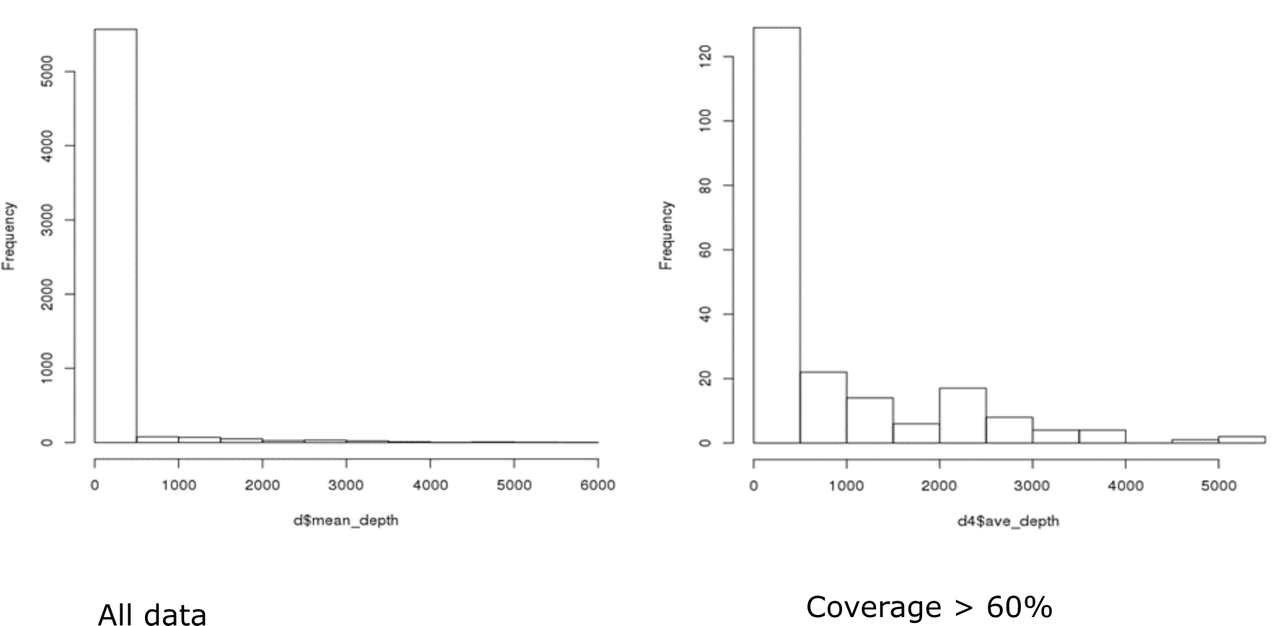
I see - thanks! Can you plot the distribution of the entire data together using the
hist()function in R and see what the distribution looks like? - just use the averageDepth column, if you can?I found a previous (virtually uncited) manuscript that suggests DESeq2 for metatransriptomic data. The distribution of your counts (depth) would have to be on the negative binomial distribution, though, and they would additionally have to be integer values (round them up or down).
From my perspective, read depth is akin to counts. Programs like featureCounts, HTseq, etc are merely just counting the aligned reads over a certain genomic region as indicated by a GTF file, after all. These counts are then normalised for differences in library sizes across your samples an also gene length (as larger genes will accumulate a larger total number of reads).
Hi Kevin, Thanks, again! Here are the distributions. I'm not really sure if they fit a negative binomial distribution...I haven't had a chance to figure out how to test for overdispersion. I'll take a look at that manuscript...if you have any thoughts about DESeq2 or other packages/methods based on these histograms I'd love to hear them!
That looks pretty much like a negative binomial to me, and a typical histogram of bulk RNA-seq data. I think that using DESeq2 is worth a try. Have you used DESeq2 before?
Nope! I need to get the admin to install a required system package before I can install DESeq2, then it should work. I'm trying it with edgeR right now to pass the time. I've read that edgeR can implement an RLE scaling method, too, and I wanted to compare TMM, edgeR's RLE, and DESeq2. Does that sound like a decent idea, or am I missing something important or making incorrect comparisons? Thanks again for your advice..this has definitely been a good learning experience so far!
You will likely get different results when you compare across EdgeR and DESeq2, which is expected. From what I understood, though, EdgeR normalises via TMM, whilst DESeq2's normalisation method is RLE. Usually people just refer to DESeq2's method as just 'DESeq2 normalisation' or 'geometric mean'.
Thanks so much. I appreciate your help!