Entering edit mode

6.8 years ago
jhamy1605
•
0
Hi all.
I am wondering the method of drawing plot like below.

Hi all.
I am wondering the method of drawing plot like below.

OncoPrinter (web-based): http://www.cbioportal.org/oncoprinter.jsp
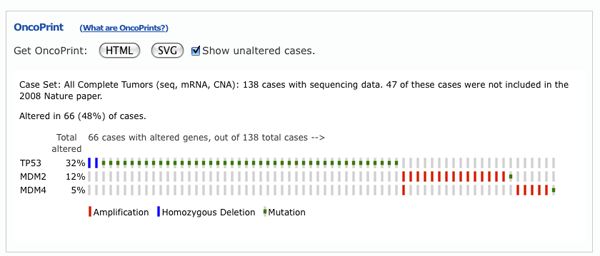
ComplexHeatmap oncoPrint() function: https://github.com/jokergoo/ComplexHeatmap

Use of this site constitutes acceptance of our User Agreement and Privacy Policy.
How to add images to a Biostars post