error with add_theme function ggplot2 (R)
1
0
Entering edit mode
6.4 years ago
tw617 ▴ 40

I am trying to make a density plot but I keep getting this same error and can't seem to figure out what is wrong. This code produced a pdf that has 4 empty, labeled boxes and no legend.

 > #density plot, use data 3 to draw density plot
> library(reshape)
> library(ggplot2)
> library(grid)
> sdata <- melt.data.frame(data3,variable_name="sample")
Using  as id variables
> colnames(sdata) <- c("sample","log2FPKM")
> pdf("densityplot.25Kall_genes.fpkm_tracking_filtered.pdf")
> 
> sp<-ggplot(sdata, aes(log2FPKM, fill = sample))
> geom_density(aes(group=sample, colour=sample, fill=sample), alpha=0.3)
mapping: group = sample, colour = sample, fill = sample 
geom_density: na.rm = FALSE
stat_density: na.rm = FALSE
position_identity 
> 
> sp2<-sp+theme(legend.key.size = unit(0.15, "cm")) +
+ theme(legend.text = element_text(size = 4)) + facet_wrap(~sample)
> +theme(legend.key.size=unit(0.9, "cm")) + theme(legend.text = 
+ element_text(size = 10)) + theme(strip.text.x = element_text(size = 
+ 15), axis.text = element_text(size = 8))
****Error in add_theme(e1, e2, e2name) : 
  argument "e2" is missing, with no defaul**t**
> sp2
> dev.off()
R • 2.9k views
ADD COMMENT
0
Entering edit mode

I think there is a typo on line where you call ggplot first time, end of the line + is missing? sp<-ggplot(sdata, aes(log2FPKM, fill = sample)) +

ADD REPLY
0
Entering edit mode

It looks like you have an extra plus here :

 sp2<-sp+theme(legend.key.size = unit(0.15, "cm")) **+** + theme(legend.text = element_text(size = 4)) + facet_wrap(~sample)
ADD REPLY
0
Entering edit mode

No, extra plus is coming from R console saying they are actually all in one row of code.

ADD REPLY
0
Entering edit mode

Just check '+' signs in your code.

ADD REPLY
5
Entering edit mode
6.4 years ago
aays ▴ 180

I think the issue wrt your error is happening here:

> sp2<-sp+theme(legend.key.size = unit(0.15, "cm")) +
+ theme(legend.text = element_text(size = 4)) + facet_wrap(~sample)

> +theme(legend.key.size=unit(0.9, "cm")) + theme(legend.text = 
+ element_text(size = 10)) + theme(strip.text.x = element_text(size = 
+ 15), axis.text = element_text(size = 8))

The second command doesn't make much sense to R on its own, without sp2 at the beginning. ggplot simply doesn't know what to add the theme objects in the second command to - hence the add_theme error.

Also worth noting: a sometimes error-inducing idiosyncrasy of ggplot is that in a chain of commands, each line has to _end_ with a +, while a + at the _start_ of a line will break your code. For instance, while

ggplot(d, aes(x, y)) +
geom_point() +
theme_bw()

is valid, the following command:

ggplot(d, aes(x, y)) +
geom_point()
+ theme_bw()

is not.

Similarly, the reason you aren't seeing your data show up is because these two commands:

> sp<-ggplot(sdata, aes(log2FPKM, fill = sample))
> geom_density(aes(group=sample, colour=sample, fill=sample), alpha=0.3)

are being interpreted separately. This is why the second command returns the specified mapping information to stdout as opposed to actually adding it to your plot object. Without having a geom as part of the plot object, ggplot simply doesn't know how to plot the data - hence the empty plot.

Instead, running the above as one command should fix the issue:

> sp<-ggplot(sdata, aes(log2FPKM, fill = sample)) +
  geom_density(aes(group=sample, colour=sample, fill=sample), alpha=0.3)

Hope this helps!

ADD COMMENT
1
Entering edit mode

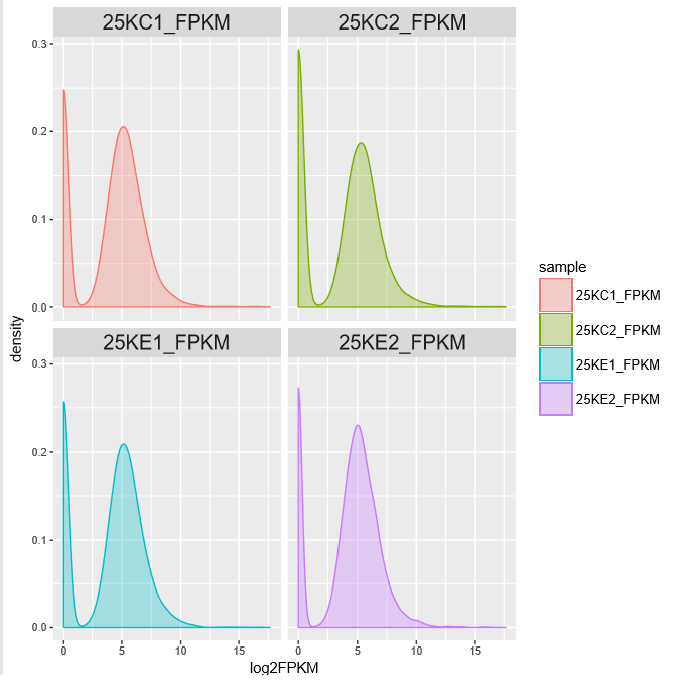
Thank you!!! These errors can be hard to localize sometimes and this had me stumped for quite some time. density plot

enter image description here2k4tewj1/

ADD REPLY
0
Entering edit mode

Happy to help! And thanks for sharing the plot - looks fantastic :)

ADD REPLY

Login before adding your answer.

Traffic: 1606 users visited in the last hour
Help About
FAQ
Access RSS
API
Stats

Use of this site constitutes acceptance of our User Agreement and Privacy Policy.

Powered by the version 2.3.6