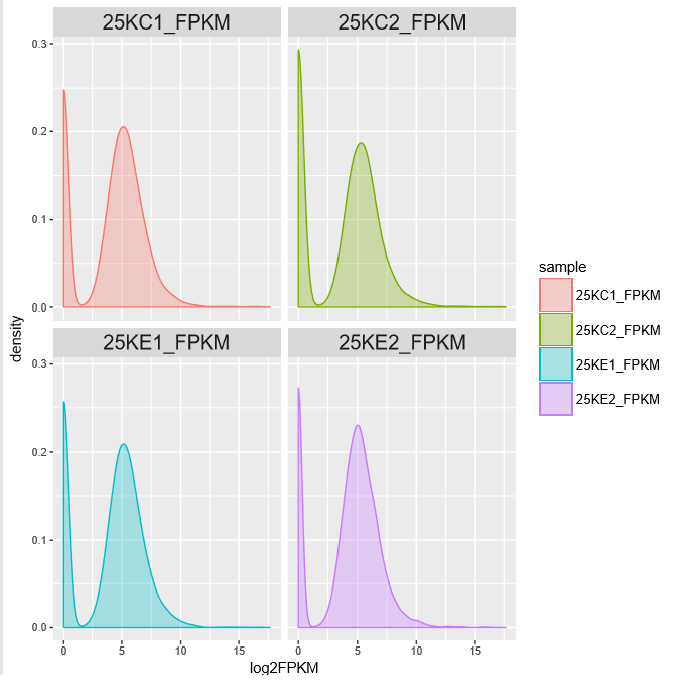
I am trying to make a density plot but I keep getting this same error and can't seem to figure out what is wrong. This code produced a pdf that has 4 empty, labeled boxes and no legend.
 > #density plot, use data 3 to draw density plot
> library(reshape)
> library(ggplot2)
> library(grid)
> sdata <- melt.data.frame(data3,variable_name="sample")
Using  as id variables
> colnames(sdata) <- c("sample","log2FPKM")
> pdf("densityplot.25Kall_genes.fpkm_tracking_filtered.pdf")
>
> sp<-ggplot(sdata, aes(log2FPKM, fill = sample))
> geom_density(aes(group=sample, colour=sample, fill=sample), alpha=0.3)
mapping: group = sample, colour = sample, fill = sample
geom_density: na.rm = FALSE
stat_density: na.rm = FALSE
position_identity
>
> sp2<-sp+theme(legend.key.size = unit(0.15, "cm")) +
+ theme(legend.text = element_text(size = 4)) + facet_wrap(~sample)
> +theme(legend.key.size=unit(0.9, "cm")) + theme(legend.text =
+ element_text(size = 10)) + theme(strip.text.x = element_text(size =
+ 15), axis.text = element_text(size = 8))
****Error in add_theme(e1, e2, e2name) :
  argument "e2" is missing, with no defaul**t**
> sp2
> dev.off()


 2k4tewj1/
I think there is a typo on line where you call ggplot first time, end of the line
+is missing?sp<-ggplot(sdata, aes(log2FPKM, fill = sample)) +It looks like you have an extra plus here :
No, extra plus is coming from R console saying they are actually all in one row of code.
Just check '+' signs in your code.