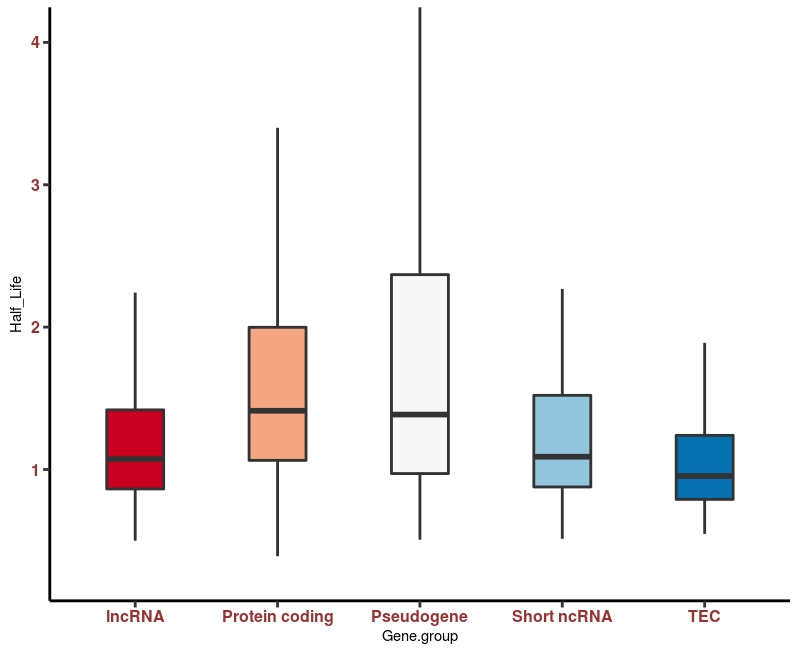
Hello - I'm using the ALL dataset from the Bioconductor suite. I'm trying to create a simple graph with 5 separate boxplots that represent the different gene expression between M/F. I can create a single boxplot without any trouble:
boxplot(exprs(ALL)["1043_s_at",]~pData(ALL)$sex)
But when I add another gene I get an error? I thought my syntax looked clean?
> boxplot(exprs(ALL)["1043_s_at","38354_at",]~pData(ALL)$sex)
Error in exprs(ALL)["1043_s_at", "38354_at", ] :
  incorrect number of dimensions
Anyone see a glaring issue with my code?


ok, thanks! It's a shame this is not a native capability for R.
ggplot2 is so common it might well be part of base R. You might want to have
library(tidyverse)as the first command of any R session.