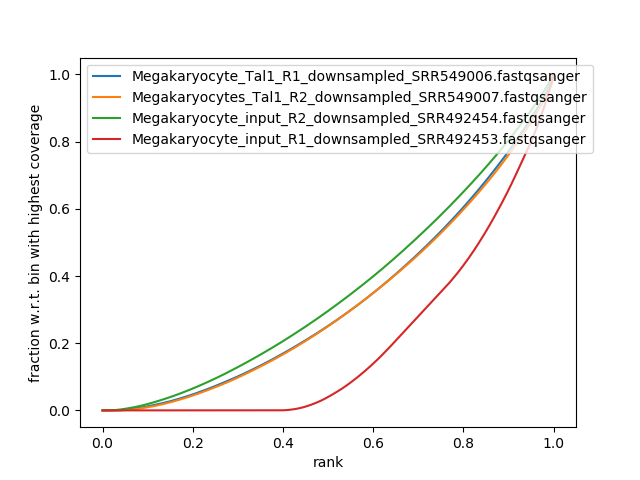
Hi, I am trying to assess IP strength of some chIP- seq data and am a little confused. My interpretation of this figure: R2 input and Tal1 treatment (green and orange) did not work correctly because the control(input) has the expected normal distribution (almost diagonal line) and the treatment line is similar to this; there is no elbow and the lines are nearly identical so these findings are non-specific. For R1 input and Tal1 treatment, it appears as though the input (control, red) is skewed and the Tal1 treatment (blue) is of a normal distribution (near-diagonal). So does this mean the R1 control (red) had low sequencing depth and the R1 treatment finding is non-specific? There are no sharp rises at high x values so I am thinking that this part of the experiment did not work. What is the correct interpretation of this figure?


