is it possible to visualize insertions in a sequence?
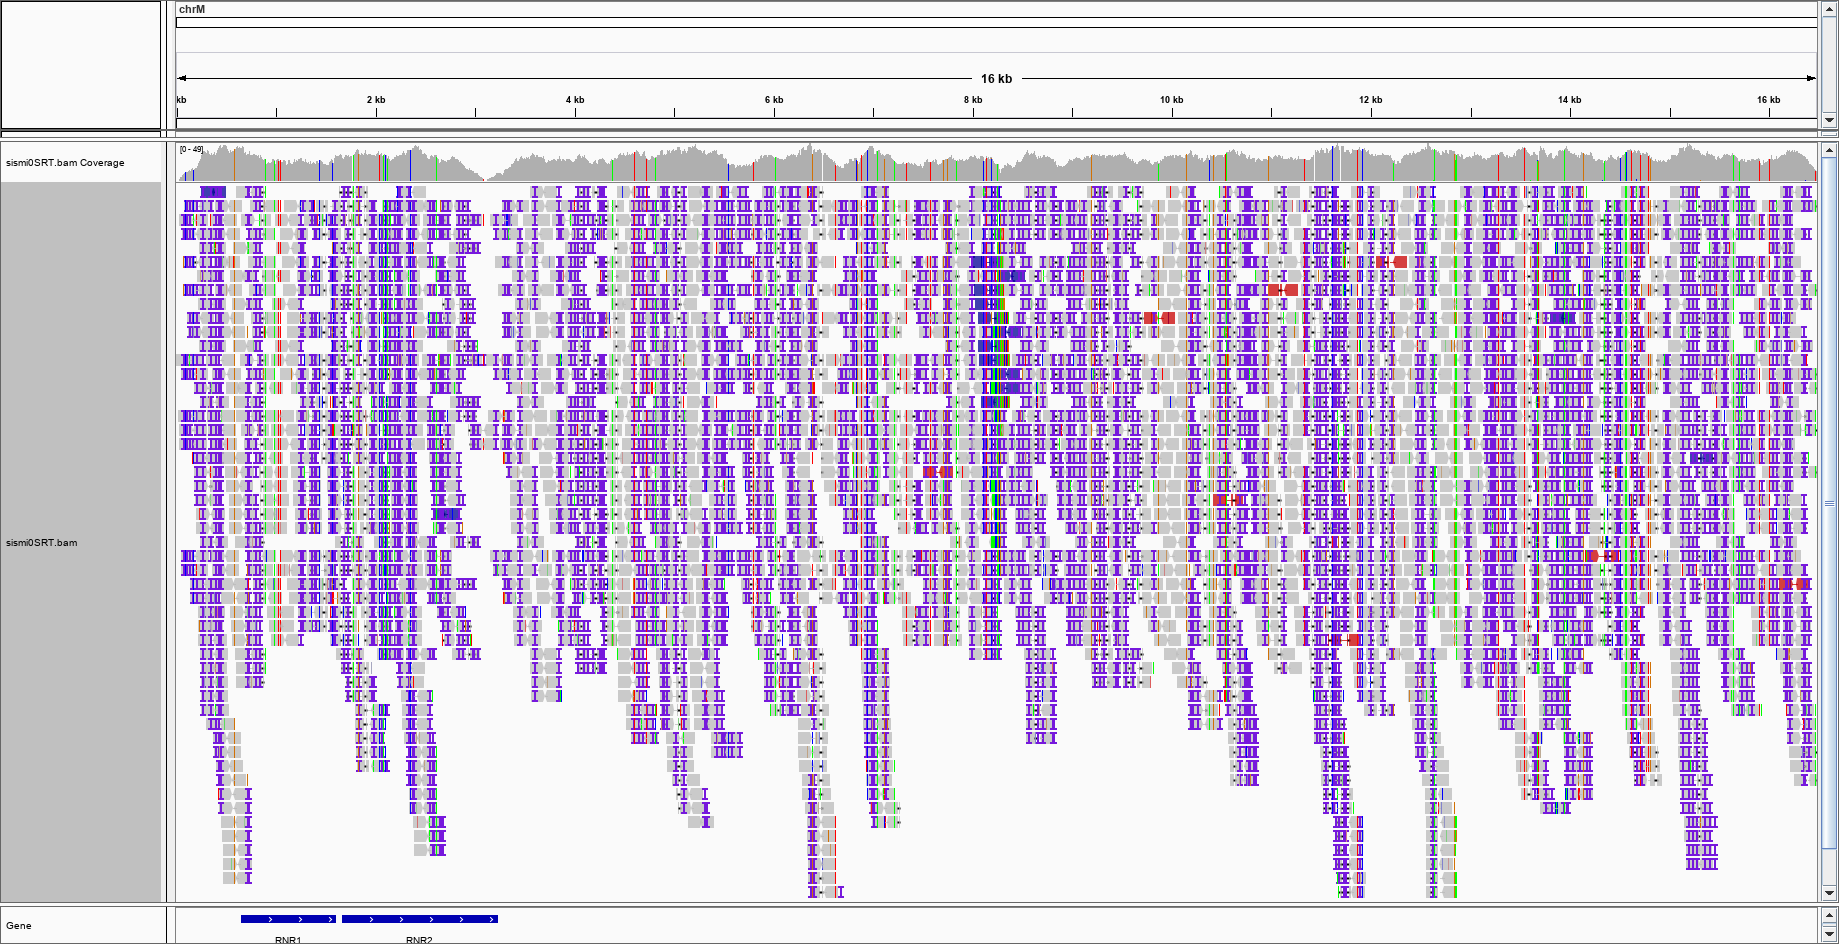
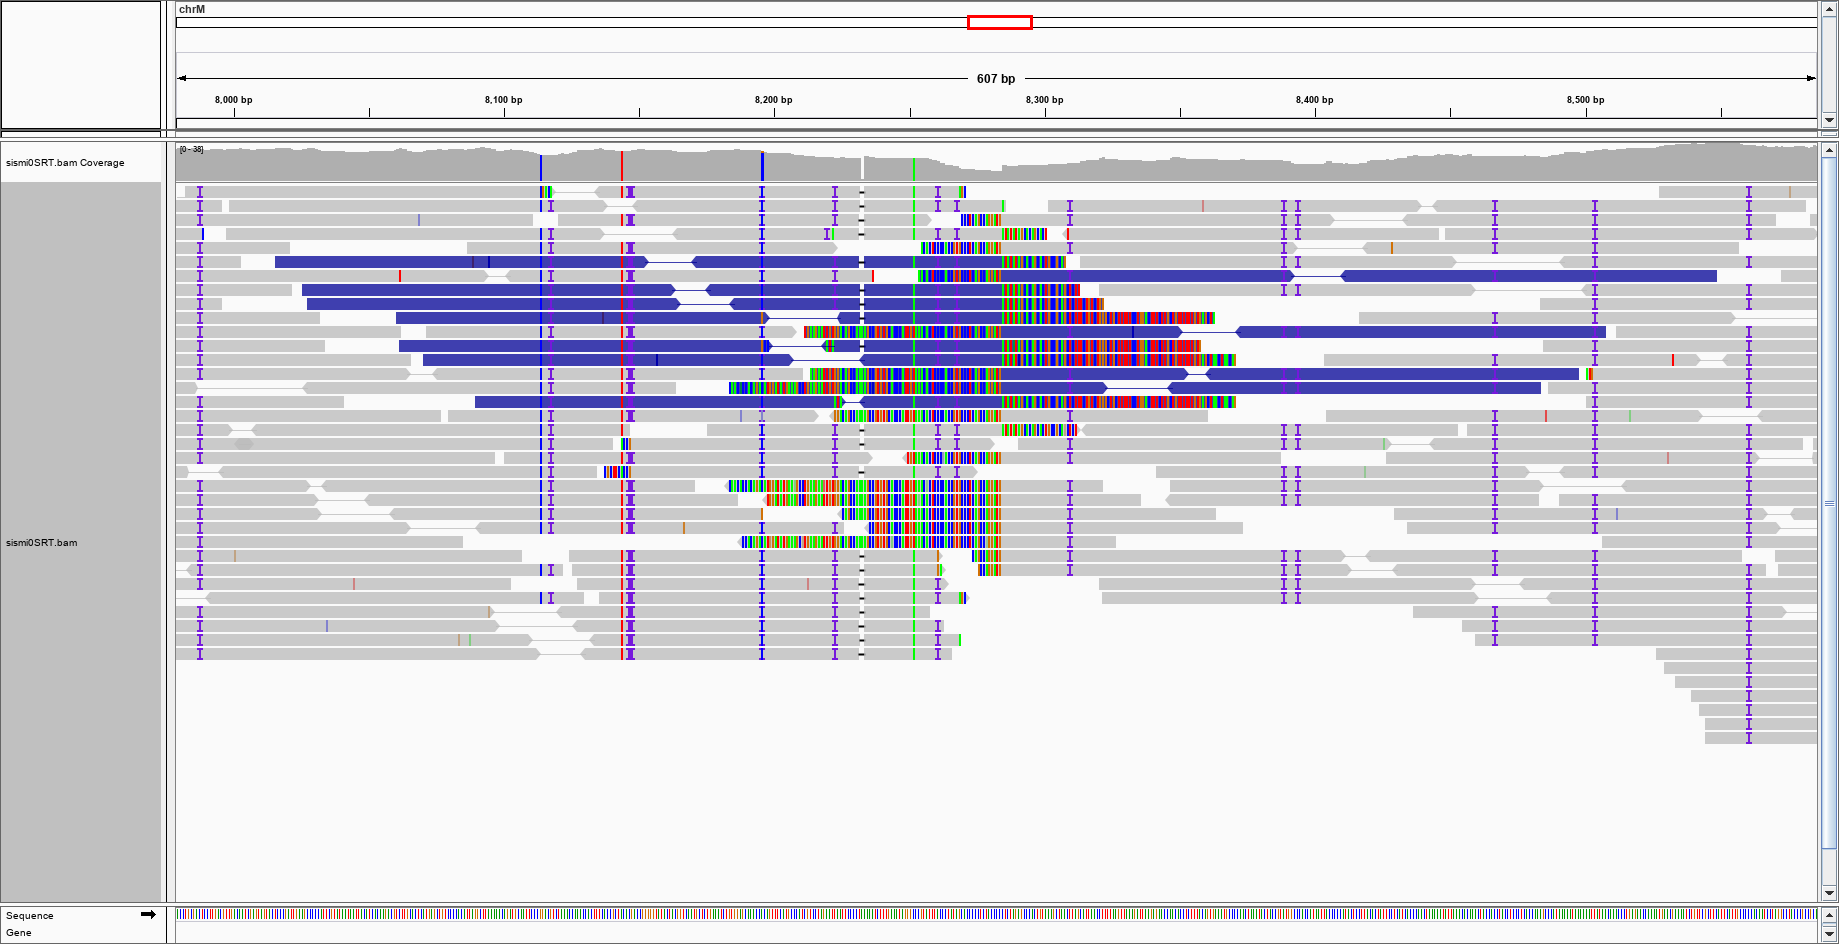
I have prepared a simulated sequence of the mitochondrial genome from the release hg38 by placing non human sequences right in the middle of it (position 8284). I then aligned the simulated genome to the mitochondrial index and the visualized the alignment with the integrated genome viewer IGV. However, I don't see any sign of insertions in the figure.
Is there a way to highlight the insertion point? Maybe by showing only clipped reads or the reads that map only on one mate?
Insertions
In a gapped alignment, IGV indicates insertions with respect to the reference with a purple I () or red I for  insertions greater than a user activated and specified cutoff.  Hover over the insertion symbol to view the inserted bases.
sorry, I forgot to mention that -- in order to differentiate the simulated sequence from the original -- I also generated random mutations in the sequence. The Is might simply who that. One might also argue that the coloured reads might mark the insertion point, but there are other regions with such colouring (not reported in the figure), so it is not a specific marker.
sorry, I forgot to mention that -- in order to differentiate the
simulated sequence from the original -- I also generated random
mutations in the sequence. The Is might simply who that
So is this real data salted with simulated reads or just plain simulated reads?
The procedure was this: I split the mitochondrial fasta file from grch38 into two pieces and merged the non human sequence in between. then I used EMBOSS to introduce random mutations and then ART to generate fastq pair mates. I then used BWA MEM to align to the mitochondrial index (prepared with BWA index for the original grch38 mitochondrial fasta).
What was the length of this sequence? When you are referring to insertions are you referring to single bp or something longer like the actual size of the non-human sequence you inserted.
The figure I get after colouring for the INSERT SIZE (and INSERT SIZE AND PAIR ORIENTATION) is this:
With a bit of imagination, one could argue that there is a purple blob in the centre of the genome, where should be the insertion point. This is the enlargement:
would this be enough to say that IGV suggests a large insertion event?
Depends on your context , if it's "somatic" insertion could be ....
By the way your alignment is full of insertion ( first picture ) is it still simulated reads ?
You artificial insertion is too big to be picked by IGV, and also to big to affect insert size, as it is probably larger than the simulated insert size. In this scenario, what you would have is an increase of one mate mapped, the other unmapped, close to the insertion point. You could argue there is an insertion larger than your sequencing insert size, but without further data, you can't say how much larger.
Do you mean highlight the insertion point in the coverage bar ?
So why don't you use another way to check insertion point ( based on coverage insertion rate with IGVtools or variant caller) and then check it on IGV ?
I thought IGV might show reads that have peculiar behaviour such as those with soft clips or a single mate mapped. If there are other tools, I will be happy to use them...
I see evidence of the "transgene" insertion: all those identical soft-clipped bases centered at the position you inserted the non-human sequence. Pay attention: 1) all reads are soft-clipped at the same reference position, 2) as far as I can tell, all soft-clipped bases are identical between different reads.
Look at the picture below. The big red arrow indicates the insertion point, and the darkened rectangles indicate the inserted sequence (which I was able to determine as parvovirus by blasting them, even before you told us it was parvovirus).
However, keep in mind this visual inspection works well because you have a simple, small and with no duplications reference genome, and a simple and small insertion, without other copies of it throughout the reference genome. As WouterDeCoster pointed above, there are better methods to identify structural variation events in more complex scenarios.
OK then, IGV is not the tool for checking insertion sites. I will use other tools. If there are other suggestions over lumpy I will be happy to check them. Thank you.
IGV is meant to visualize your alignment. It is not a variant caller. Appropriate tools for SV identification exist, e.g. lumpy
In IGV, insertions are represented with I. I can see a bunch of purple I in your snapshot. Please refer to: http://software.broadinstitute.org/software/igv/AlignmentData for more info.
sorry, I forgot to mention that -- in order to differentiate the simulated sequence from the original -- I also generated random mutations in the sequence. The Is might simply who that. One might also argue that the coloured reads might mark the insertion point, but there are other regions with such colouring (not reported in the figure), so it is not a specific marker.
So is this real data salted with simulated reads or just plain simulated reads?
The procedure was this: I split the mitochondrial fasta file from grch38 into two pieces and merged the non human sequence in between. then I used EMBOSS to introduce random mutations and then ART to generate fastq pair mates. I then used BWA MEM to align to the mitochondrial index (prepared with BWA index for the original grch38 mitochondrial fasta).
What was the length of this sequence? When you are referring to
insertionsare you referring to single bp or something longer like the actual size of the non-human sequence you inserted.I placed a stretch of 4000 bases from Parvovirus B19 after base 8284 of the mitochondrion, then introduced 500 mutattions with msbar.
Take a look at the "Detecting structural variants" section on this IGV help page.
The figure I get after colouring for the INSERT SIZE (and INSERT SIZE AND PAIR ORIENTATION) is this:
With a bit of imagination, one could argue that there is a purple blob in the centre of the genome, where should be the insertion point. This is the enlargement: would this be enough to say that IGV suggests a large insertion event?
Depends on your context , if it's "somatic" insertion could be .... By the way your alignment is full of insertion ( first picture ) is it still simulated reads ?
yes. since there are 3 types of mutations in msbar (insertion, deletion, substitutions), there should be in theory 500/3 insertions points.
You artificial insertion is too big to be picked by IGV, and also to big to affect insert size, as it is probably larger than the simulated insert size. In this scenario, what you would have is an increase of one mate mapped, the other unmapped, close to the insertion point. You could argue there is an insertion larger than your sequencing insert size, but without further data, you can't say how much larger.
Do you mean highlight the insertion point in the coverage bar ? So why don't you use another way to check insertion point ( based on coverage insertion rate with IGVtools or variant caller) and then check it on IGV ?
I thought IGV might show reads that have peculiar behaviour such as those with soft clips or a single mate mapped. If there are other tools, I will be happy to use them...
You have to enable "show soft clipped bases" in IGV preferences.
yes I did. The figure reports clipped reads included