I have several (15) very long lists of genes that I want to convert into a binary (present or absent, like a 0 or 1) format in order to compare the sets graphically. Is there a speedy and straightforward way to achieve this?
Efficient way to convert several lists into a present/absent binary format?
0
Entering edit mode
6.9 years ago
stellaparker
▴
10
2
Entering edit mode
6.9 years ago
Kevin Blighe
89k
It depends on how your data is stored.
data-frame
If you have a data-frame, which is just a bunch of lists bound together as columns, then:
df[1:5,1:3]
           ENSG00000003436 ENSG00000003509 ENSG00000003756
SRR1039508       -0.154185       -0.467447        1.029358
SRR1039509        0.300399        1.000699       -0.880699
SRR1039512        0.564815        0.570839        0.885798
SRR1039513        0.466665       -0.241819       -0.711149
SRR1039516        1.818353        1.663692        0.704480

# choose cutoff
cutoff <- 0

# encode the data based on the cutoff
df[df >= cutoff] <- 1
df[df < cutoff] <- 0

df
               ENSG00000003436 ENSG00000003509 ENSG00000003756 ENSG00000003987
    SRR1039508               0               0               1               0
    SRR1039509               1               1               0               1
    SRR1039512               1               1               1               0
    SRR1039513               1               0               0               1
    SRR1039516               1               1               1               0
    SRR1039517               0               0               0               1
    SRR1039520               0               0               1               0
    SRR1039521               0               0               1               1
list array
If you genuinely have a bunch of separate lists, then put them into a list array and then loop through it with lapply. If you require parallel processing, then use mclapply (linux / Mac) or parLapply (Windows).
listarray
[[1]]
           ENSG00000003436 ENSG00000003509 ENSG00000003756 ENSG00000003987
SRR1039508       -0.154185       -0.467447         1.02936       -0.863616
           ENSG00000003989 ENSG00000004059 ENSG00000004139 ENSG00000004142
SRR1039508        0.424448       -0.849895      -0.0667141       0.0506826
           ENSG00000004399 ENSG00000004455 ENSG00000004468 ENSG00000004478
SRR1039508        0.472002       -0.200672         1.41956        0.606892
           ENSG00000004487 ENSG00000004534 ENSG00000004660 ENSG00000004700
SRR1039508        0.956724        -0.63459         0.57747       -0.684747
           ENSG00000004766 ENSG00000004776 ENSG00000004777 ENSG00000004779
SRR1039508       0.0928506        0.747022         1.03611        -1.20849

[[2]]
           ENSG00000003436 ENSG00000003509 ENSG00000003756 ENSG00000003987
SRR1039509        0.300399          1.0007       -0.880699        0.324717
           ENSG00000003989 ENSG00000004059 ENSG00000004139 ENSG00000004142
SRR1039509        0.906938         1.20174         0.87063          1.5638
           ENSG00000004399 ENSG00000004455 ENSG00000004468 ENSG00000004478
SRR1039509         1.21575        0.139162       -0.166843         1.15727
           ENSG00000004487 ENSG00000004534 ENSG00000004660 ENSG00000004700
SRR1039509       -0.919423       -0.904989       -0.420378         1.11492
           ENSG00000004766 ENSG00000004776 ENSG00000004777 ENSG00000004779
SRR1039509       -0.784583        0.785423        0.947548        0.252098

do.call(rbind, lapply(listarray, function(x) ifelse(x >= cutoff, 1, 0)))

           ENSG00000003436 ENSG00000003509 ENSG00000003756 ENSG00000003987
SRR1039508               0               0               1               0
SRR1039509               1               1               0               1
SRR1039512               1               1               1               0
SRR1039513               1               0               0               1
Edit 26th September, 2018:
The modified answer is:
df <- data.frame(
  col1=c('A','B','C','D','E','F','G','H'),
  col2=c('B','D','E','G','I','J','F','A'),
  col3=c('A','B','C','E','G','H','X','C'),
  col4=c('K','K','L','L','V','V','W','W'),
  stringsAsFactors = FALSE
)

key <- as.character(df$col1)

data.frame(
  key = key,
  do.call(
    cbind,
    lapply(
      df[,2:ncol(df)],
      function(x) ifelse(key %in% x == TRUE, 1, 0))))

  key col2 col3 col4
1   A    1    1    0
2   B    1    1    0
3   C    0    1    0
4   D    1    0    0
5   E    1    1    0
6   F    1    0    0
7   G    1    1    0
8   H    0    1    0
For each value in key, it looks (row-wise) to see if the value in key is present in col2, col3, col4, et cetera. In col2, for example, only C and H are not in the key. In col3, D and F are not in it.
Kevin
Similar Posts
Error! readyState=0 status=error text=
Loading Similar Posts
Traffic: 2320 users visited in the last hour
Use of this site constitutes acceptance of our User Agreement and Privacy Policy.


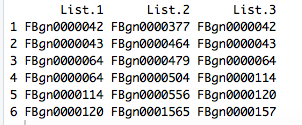
I'm currently in a format where I have the "list name" as my column header, followed by the genes themselves listed down the column with the next list in the next column.
So, its a data-frame (?)
Not quite as in the example that you have posted above, like this:
I see. What is the rule for converting these to 1 or 0?
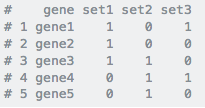
I'm not sure if there is an easy way, but I would ultimately need to be in an actual data frame with each gene in column 1 and the following columns being each list with either a 1 or 0 at each gene position depending on its presence in the list. Or each being a column and each list being a row with a 1 or 0 in each column going across.
It does not sound difficult; however, you should provide some sample / expected output.
For example, take a look at this:
This is the goal:
The code that I have just used should work, in that case. Your 'key' is the gene column
That seems to work very well! Thank you so much!
Great to hear. Remember, no working on Sunday :)
It looked to work initially, but it seems that if there is any value in the "Gene" column and there is also any value at all in then subsequent column, it outputs a "1". It doesn't provide a "1" if the actual gene is there or not.
Okay, in addition to the desired output that you posted (a few comments up), can you show what the input of that desired output would have been?
The short function that I wrote behaves exactly as I intend it to. Perhaps I am not 100% understanding what you are aiming to achieve.
Here it is shown another way:
Do you mean that the genes have to match on the same row?
They need to match but not necessarily in the same row, but by presence in the key. Like in your example, col2 has an F but it's in row 7 and not 6, so it gets a "FALSE", but an F is really in the list.
Are you sure? I think that it does assign TRUE for the 'F' in col2.
Here is another example:
Note that functionality may be unexpected if your genes are encoded as factors. They should be encoded as characters
Hang on, I now know that this is what you meant:
You just have to switch the order of
x %in% keytokey %in% x.