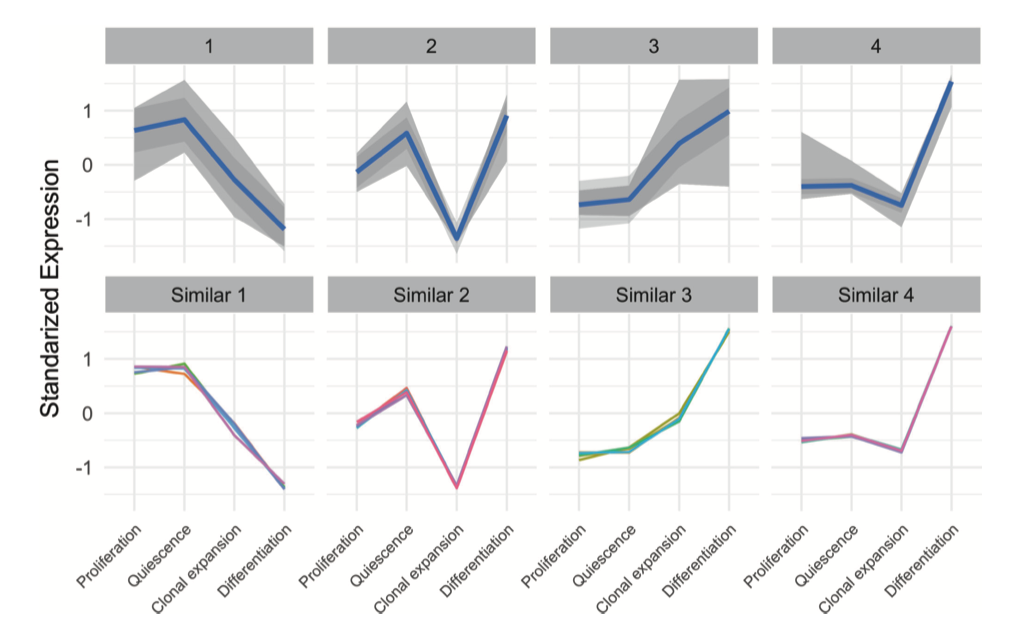
I have solved the problem, the code should be something like below:
You need to run DESeq2 before processing rowMeans:
library(ggplot2)
library(DESeq2)
cds <- DESeq(cds)
vst <- getVarianceStabilizedData(cds)
df <- vst
df <- df - rowMeans(df)
df <- as.data.frame(df)
colnames(df)
res_km <- kmeans(df, 5, nstart = 10)
data_plot <- data.table(melt(data.table(class = as.factor(res_km$cluster), df)))
data_plot[, Time := rep(1:ncol(df), each = nrow(df))]
data_plot[, ID := rep(1:nrow(df), ncol(df))]
head(data_plot)
centers <- data.table(melt(res_km$centers))
setnames(centers, c("Var1", "Var2"), c("class", "Time"))
centers[, ID := class]
centers[, gr := as.numeric(as.factor(Time))]
head(centers)
head(data_plot)
ggplot(data_plot, aes(variable, value, group = ID)) +
facet_wrap(~class, ncol = 2, scales = "free_y") +
geom_line(color = "grey10", alpha = 0.65) +
geom_line(data = centers, aes(gr, value),
color = "firebrick1", alpha = 0.80, size = 1.2) +
labs(x = "Time", y = "Load (normalised)") +
theme_bw()


Please elaborate on what you have so far. Presumably:
?
Elaborate further.
Hi
1- Yes, I have a count matrix from 15 samples and 5 group, 3 replicates per group, and rows are gene name. The relative expression could be made from log2 counts.
2-Exactly right, I need to make 3-6 cluster, which each gene got a cluster number.
Great, and from where have you taken that figure that you put in your initial question? The term 'standardized expression' could be interpreted in an innumerable number of ways in the context of k-means clustering.
There are also generally many different ways of presenting k-means cluster information:
Thanks Kevin.
Would you please share the R code for my attached image and also above two plots?
The initial plot that you showed was generated with ggplot2, I believe, and using the
facet_wrap()function. I give a quick example of this, but for histograms, here: A: Network/Pathway Analysis from Mass Spec dataThe code for the plots that I showed is here: https://github.com/kevinblighe/cytofNet
You have not answered my other question: "from where have you taken that figure that you put in your initial question?"
It does not appear that you have invested much time in actually understanding what the plot (the one that you posted) is showing.
Dear Kevin,
Thanks for answer and good example. I have found the image from this paper. Yes you are right I've made the code by using ggplot2.
Updated - there is now a tutorial here: https://github.com/kevinblighe/E-MTAB-6141
How exactly did you standardize your gene expession levels?