Hi
I have several questions and I appreciate for answer :
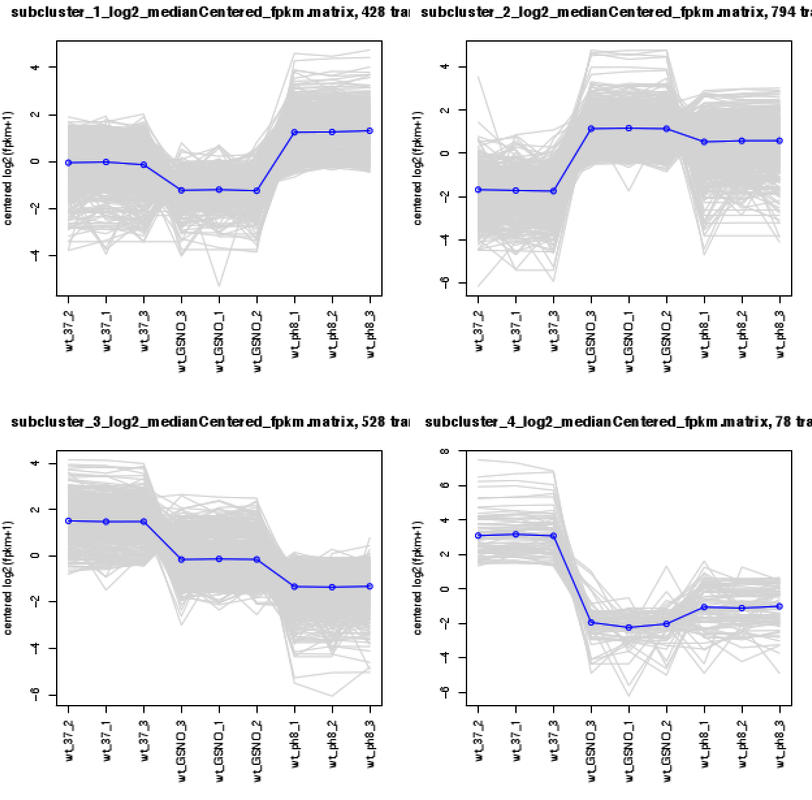
1- I wanted to know how can I add cluster analysis like below image based on read count. 2- Should I run the code only for the genes with minimum number of reads (e.g rowSum(gene) > 10) or I should run it only for DEGs ?
Tnx.


Thanks,
Do you have any idea of creating such plot with R?
you need to calculate the z-scores ((x-mean)/sigma) for the counts. From this, follow any tutorial on plotting in R. You should be able to get the above plots. With CLUST, you can get similar plots. https://github.com/BaselAbujamous/clust