Visualization tool integrating point mutations, copy number alterations, and structural variations
2
5
Entering edit mode
6.0 years ago
brettgao2018 ▴ 150

When analyzing clinical genomes, I often find it hard to visualize the genomic context of a potential driver mutation (say a point mutation on a key cancer gene). For example, is there simultaneous LOH/amplification at the mutation locus? How many copies of the mutant allele are there? Did the mutation arrive before/after the overlapping copy number change? Is there a structural variation breakpoint near by? Are there other point mutations close by?

Thus, I wonder if there is a plotting tool that visualizes a local range of the genome (e.g. a window big enough to inspect a gene) that integrates (in one plot):

  1. Point mutations in the region
  2. The local copy numbers (major/minor allele if available)
  3. SVs affecting the region

Note that the purpose is more to infer the consequence of a mutation as opposed to validating whether the mutation is real or not, which we can already do with a variety tools such as samtools tview.

Circos is a nice format that integrates all three classes of mutations, but it is more for global scale inspections and does not provide enough resolution to zoom into specific gene regions in order to answer the above questions about key mutations of interest. Another close one is IGV, but it does not incorporate allelic specific copy number info.

Thanks!

genome next-gen gene • 3.4k views
ADD COMMENT
5
Entering edit mode
6.0 years ago
bernatgel ★ 3.4k

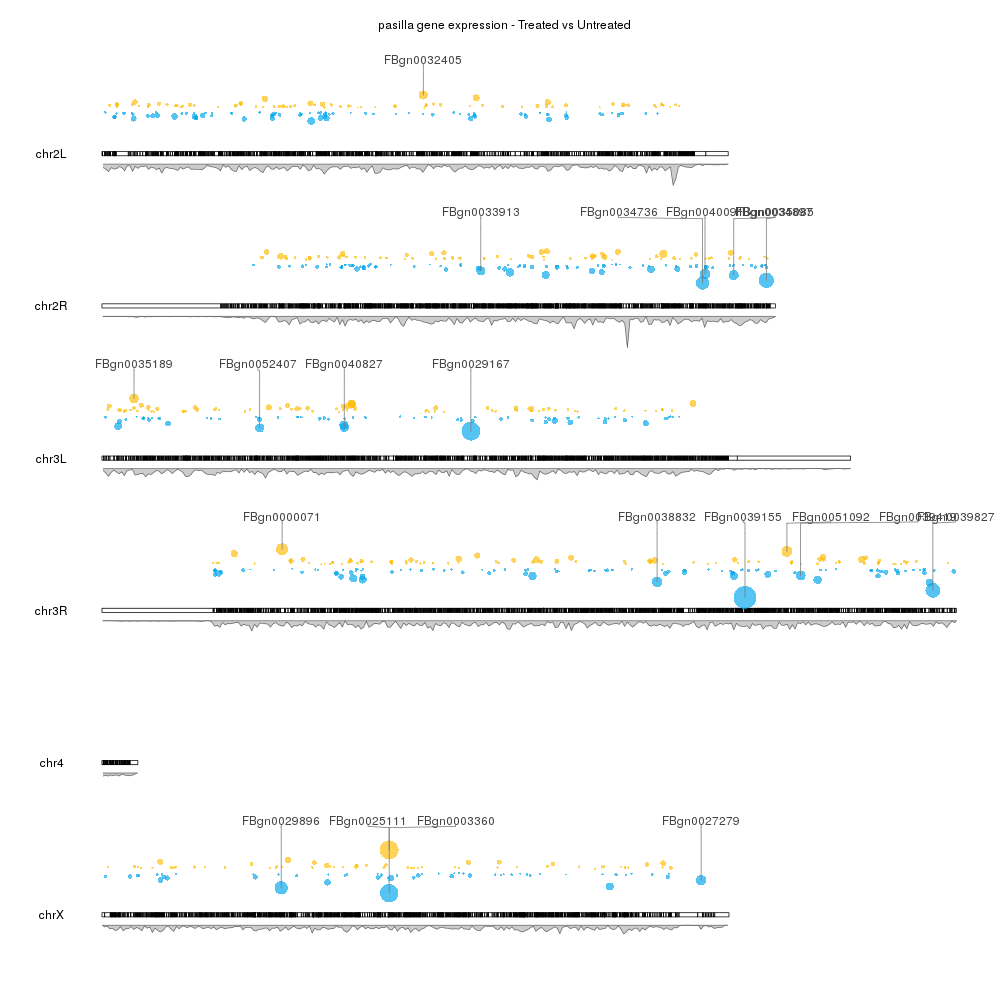
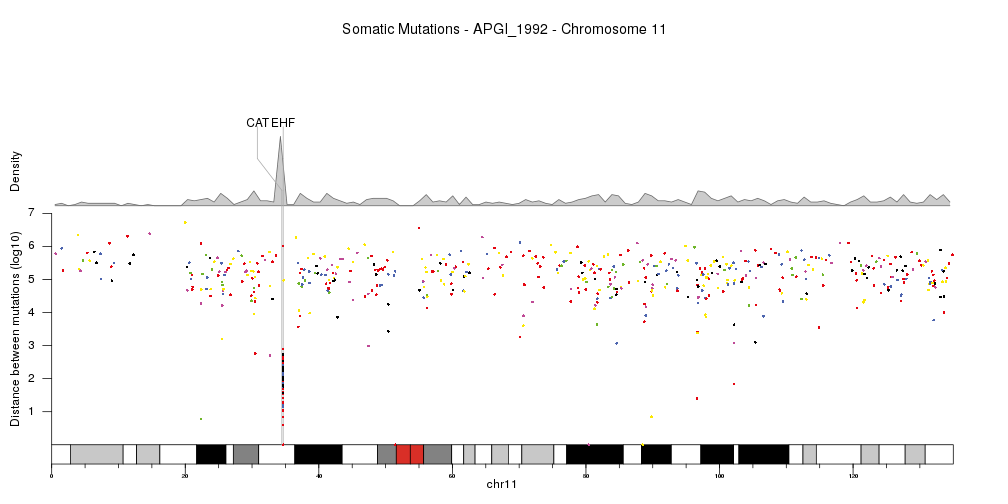
You can give a try to karyoploteR. It's an R package to plot data on genomes and can go from single base to the whole genome. Take a look at the tutorial and examples to see what it looks like. It's only a plotting tool and does not know much biology, so it can plot almost anything as long as you have it precomputed and can map it to any of the available plot types. Right now it does not have the possibility of plotting individual sequencing reads from a BAM file, if you need that.

A couple of examples of whole genome views.

Note: Setting zoom to a small genomic region in the call to plotKaryotype will created a zoomed in version of the plots with the exact same code.

enter image description here enter image description here enter image description here

ADD COMMENT
1
Entering edit mode

This is a really neat solution!

ADD REPLY
2
Entering edit mode
6.0 years ago

Point mutations in the region

try IGV http://software.broadinstitute.org/software/igv/

I wrote

The local copy numbers (major/minor allele if available)

http://lindenb.github.io/jvarkit/WesCnvSvg.html

http://lindenb.github.io/jvarkit/WesCnvTView.html

SVs affecting the region

http://lindenb.github.io/jvarkit/SvToSVG.html

ADD COMMENT
0
Entering edit mode

Thanks, but I'm more looking for a visualization that shows all three kinds of alterations in one plot, so that it's possible to put everything in context and infer the consequence/evolutionary history of a point mutation (e.g. allelic dosage, timing of the point mutation with respect to the copy number change at the locus)

ADD REPLY

Login before adding your answer.

Traffic: 1232 users visited in the last hour
Help About
FAQ
Access RSS
API
Stats

Use of this site constitutes acceptance of our User Agreement and Privacy Policy.

Powered by the version 2.3.6