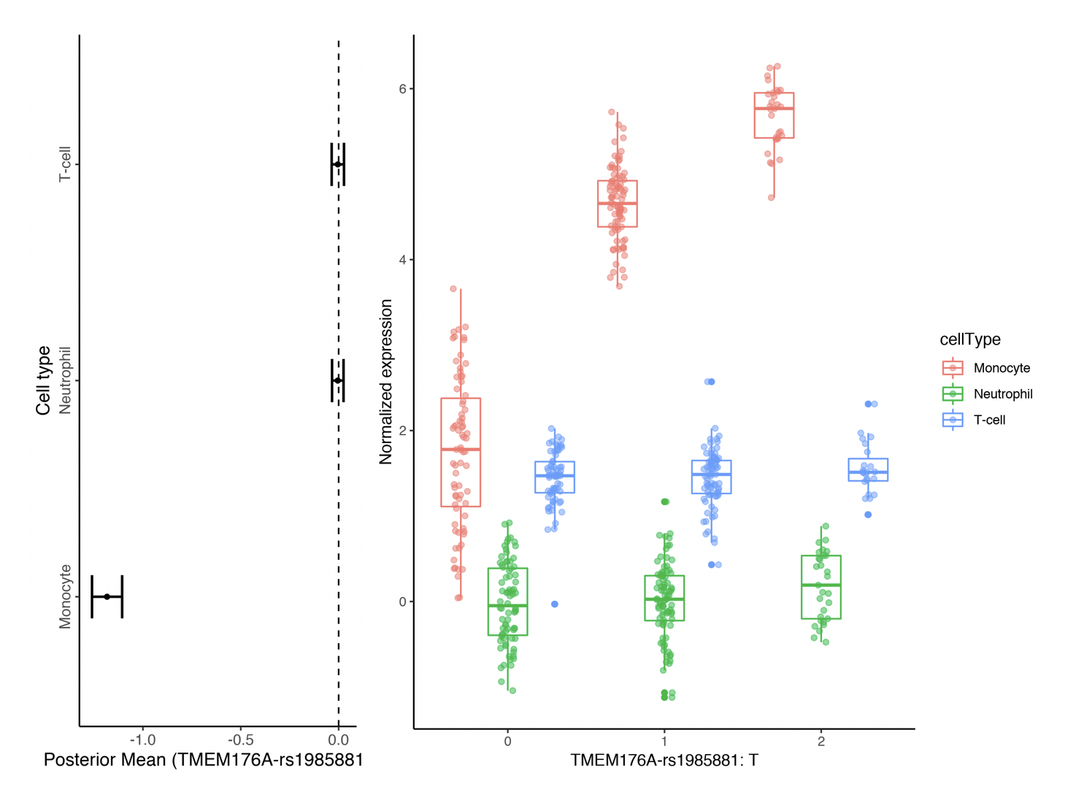
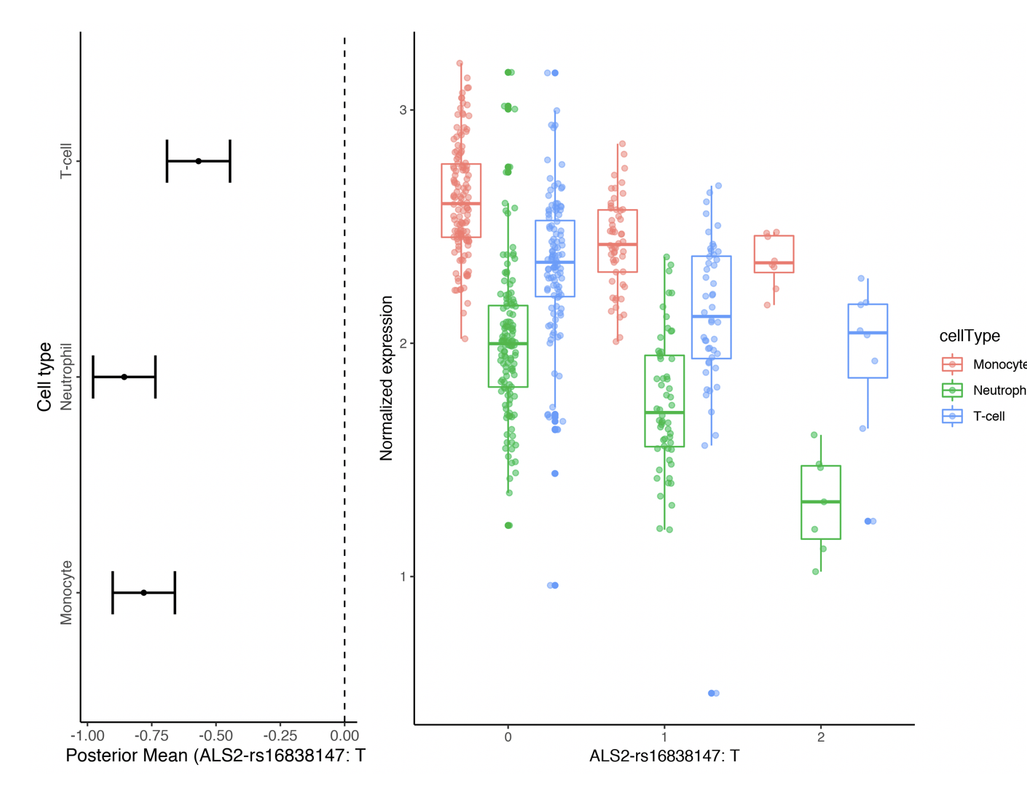
I am doing an eQTL mapping analysis. After getting my results, I can plot the slope from regression with normalized expression together to visualize the results. But I found something that is really wired when doing this.


As you can see, in the first picture, the slope is negative in regression, but box plot suggests that it should be the opposite. But in the second plot, the direction actually matches. I speculate that the allele coding file in my original VCF file is flipped for some SNPs, but not all of them. I downloaded this data from published so I am not sure whether this can happen.
Any ideas about what's going on?

