Visualizing CNV data based from bed or bedgraph format
3
0
Entering edit mode
5.8 years ago
sm.hashemin ▴ 90

Hi,

I was wondering if there is a package or script which may visualize multi-panel CNV just IGV does but with more flexibility from a cohort of bedgraph files? preferably in R? Sushi R package does not have a point based visualization otherwise might have been perfect.

Best

CNV IGV R bed bedgraph • 4.9k views
ADD COMMENT
1
Entering edit mode

Have you checked aCNViewer tool?

ADD REPLY
2
Entering edit mode
5.8 years ago
bernatgel ★ 3.4k

Hi sm.hasehmin,

You can use the Bioconductor package karyoploteR for this. You can plot the data as points using kpPoints as in the example below or you could change that to kpSegments to show the width of your data elements, for example. There's more information on the available functions and customization options at the karyoploteR tutorial.

To load the bedgraphs into R you can use toGRanges from regioneR. In the example I'm using bedgraph example data from Sushi which is not CNV data, but with only minor changes (setting ymin and ymax) you should be able to adapt the code to CNV values. To load your data, you can give toGRanges the file name of your bedgraphs and it should load them.

For the vertical positioning (r0 and r1) I'm using autotrack. This function is not yet in the tutorial but the inline documentation should suffice.

Note: since the example datasets have only data for a small region of chromosome 11 this is what we are plotting. Removing the zoom argument from plotKaryotype will plot the whole genome.

#Load 3 example bedgraphs from the datasets in the Sushi package
library(Sushi)
data(list=c("Sushi_DNaseI.bedgraph","Sushi_ChIPSeq_CTCF.bedgraph",
        "Sushi_ChIPExo_CTCF.bedgraph"), package="Sushi")

dd <- list(CTCF_Exo=Sushi_ChIPExo_CTCF.bedgraph,
           CTCF_Chip=Sushi_ChIPSeq_CTCF.bedgraph,
           DNase=Sushi_DNaseI.bedgraph)

png("bedgraphPlot.png", width = 1500, height = 1000)
  kp <- plotKaryotype(zoom="chr11:1643216-2359707", main = "BedGraphs", cex=3)
  kpAddBaseNumbers(kp, tick.dist = 10e4, add.units = TRUE, cex=1.8)
  for(i in seq_len(length(dd))) {
    names(dd[[i]]) <- c("chr", "start", "end", "value") 
    gr <- toGRanges(dd[[i]])
    at <- autotrack(i, length(dd), margin = 0.1)
    kpPoints(kp, data=gr, ymax=max(gr$value), r0=at$r0, r1=at$r1, col=rainbow(10)[i])
    kpAddLabels(kp, labels = names(dd)[i], r0=at$r0, r1=at$r1, cex=2)
  }
dev.off()

And you would get something like this
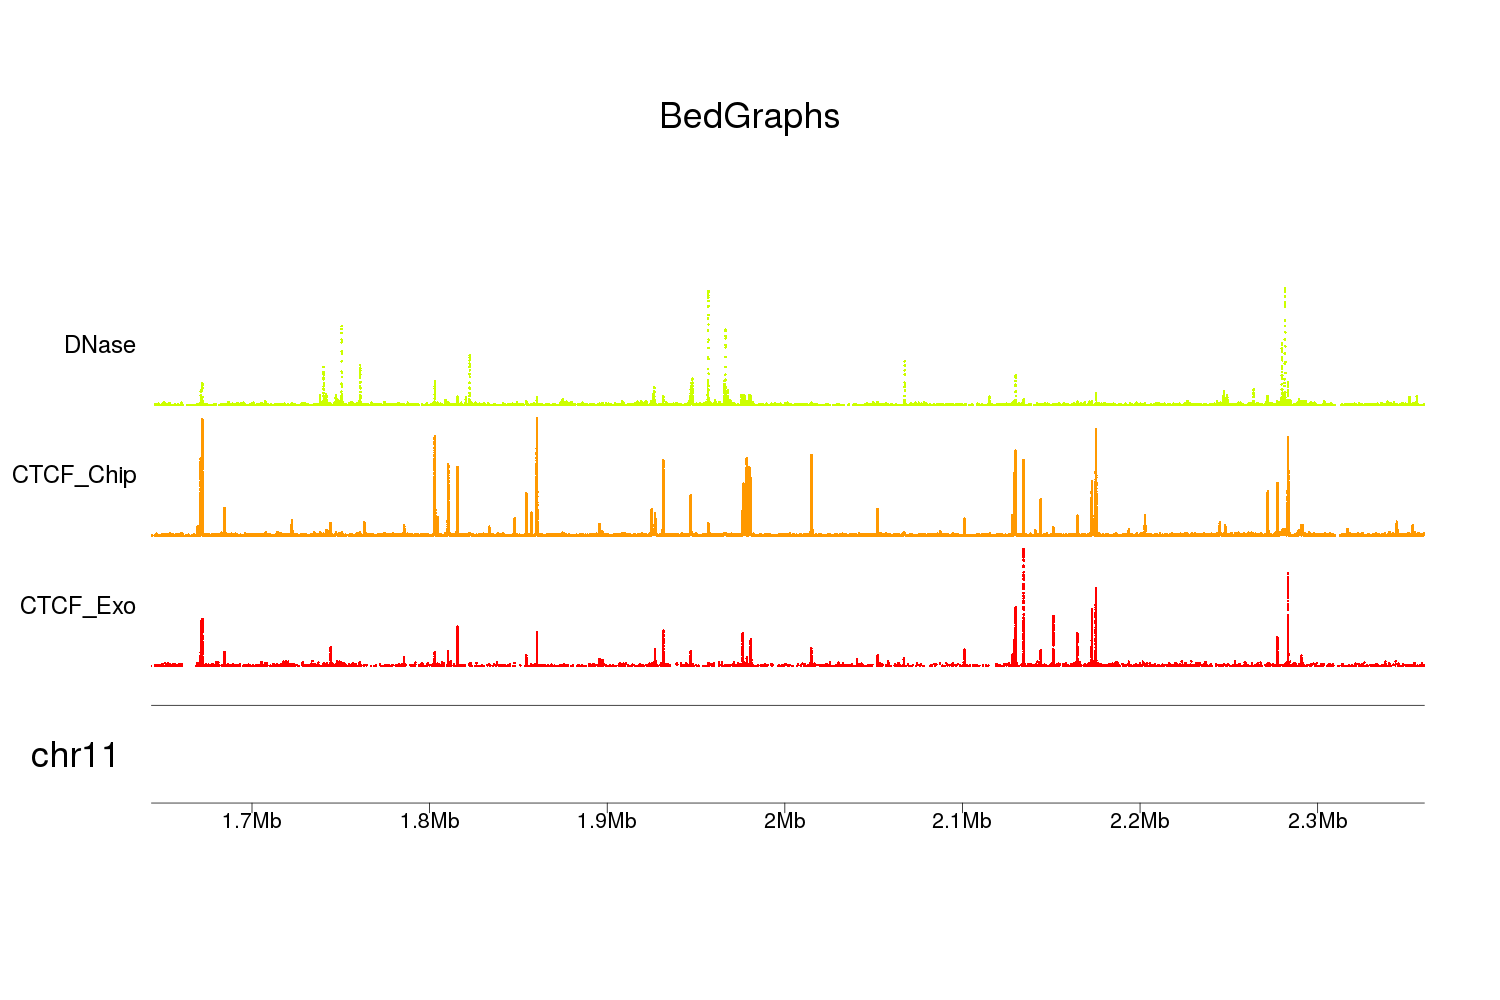
enter image description here

ADD COMMENT
0
Entering edit mode

Thanks alot. I removed the zoom argument and the representation was a bit two detailed for an overview of genomic changes. Is the reperesentaion like this possible ? https://us.v-cdn.net/5019796/uploads/FileUpload/58/15ca12b0618250b498391fe5562fb9.png

ADD REPLY
1
Entering edit mode

Sure, to have all chromosomes in one line use

kp <- plotKaryotype(plot.type=4)

and keep everything else the same. There are various plot types available to choose from. You can find them in the tutorial page.

The SNP-array data example might be useful to you. At the end your data is very similar to the LRR in SNP arrays.

enter image description here

ADD REPLY
0
Entering edit mode
5.8 years ago

some tools I wrote:

http://lindenb.github.io/jvarkit/WesCnvSvg.html

http://lindenb.github.io/jvarkit/WesCnvTView.html

ADD COMMENT
0
Entering edit mode
5.8 years ago
sm.hashemin ▴ 90

Thanks a lot for the answers I am more searching for a representation like the following. As I have no normal samples I had to use ControlFREEC and reanalysis with another software is not an option.

enter image description here

ADD COMMENT

Login before adding your answer.

Traffic: 2494 users visited in the last hour
Help About
FAQ
Access RSS
API
Stats

Use of this site constitutes acceptance of our User Agreement and Privacy Policy.

Powered by the version 2.3.6