We have noticed something that we thought other people might want to see (and possibly help provide some useful advice to us). This isn’t something that we plan to publish in a peer-reviewed publication, but I wanted to post it on Biostars because I thought it should be something less formal than a pre-print (even though I also believe Biostars discussions should sometimes be considered citable in peer-reviewed journal articles).
I am a Bioinformatics Specialist in the Integrative Genomics Core. So, I would argue my title as well as using bcl2fastq (with the --barcode-mismatches 0 parameter) and interop are main reasons for posting this here (in addition to being accessible to everybody and having a nice comment system).
Please click here to view a summary of some analysis with a subset of our runs in 2018 with mixes of different sample types (such as single-barcode, dual-barcode, and 10X Genomics samples), where we tested calling single-barcode samples as dual-barcode samples:
We happened to do this for one run, where we noticed 5-15% read loss with the dual-barcodes (I believe Jinhui Wang noticed this). Xiwei Wu then asked me to test with more runs (the median read loss was 15%, but you can see the variation per-sample on slide #7, in the PDF posted on GitHub).
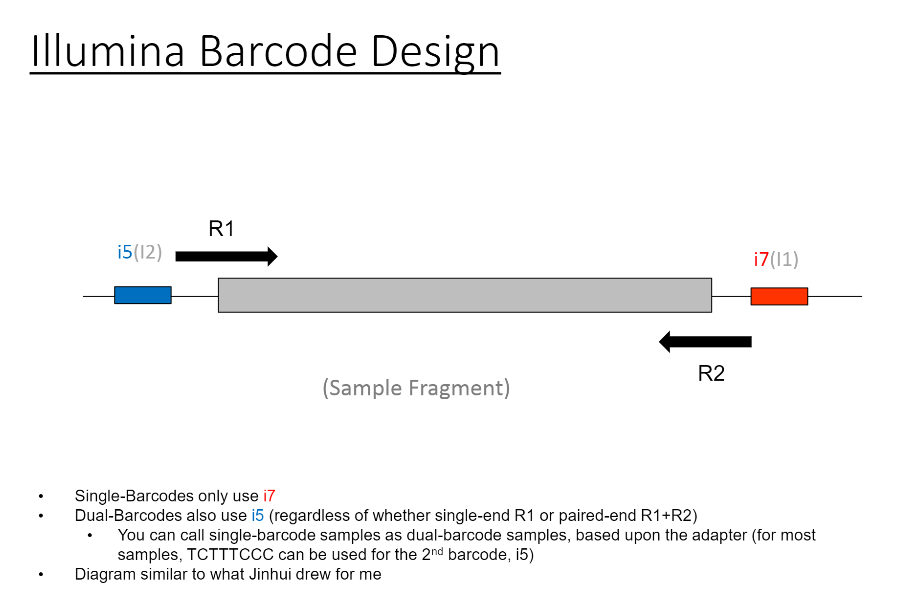
If we have the correct 2nd barcode (for otherwise single-barcode samples), the I2 quality scores (for the 2nd index, also called i5, see slide #2) affect the percent of reads kept for SingleBarcode-as-DualBarcode samples (slide #8). There is some tentative evidence that not having mixed barcode types within the 8 lanes of a HiSeq Regular Run (which is one reason why bcl2fastq has to be run for base calling) can help with the expected read percentages (slide #19, versus slides #16 and #18). There is also promising (but limited) evidence that the percent of reads lost in dual-barcode samples matters more for paired-end (PE) samples than single-end (SE) samples (slide #12-14 and #17). While some conclusions are hard to make with a limited number of runs, I believe these as quality flags may be useful for future runs:
a) >40% of samples have <50% Q30 I2 Reads
The Percent >Q30 Values were extracted from the InterOp binary files, after converting them to text files (the plot above is for single-barcode paired-end samples mixed with dual-barcode samples, showing lower I2 Q30 values noticeably decreases the percent of reads called for a single-barcode sample when treated as a dual-barcode sample). In terms of generating a table with those percent >Q30 values, the most relevant command would be:
/path/to/interop/build/src/apps/imaging_table . > interop_imaging_table.txt
In other words, the plot above uses the average values, and the plot below provides examples of why I think showing the distribution of I2 Q30 values may be useful as a QC metric in future runs:
While the precise metric and plot (see slide #9 versus #10) is a little different for quality flag a), the need to have >Q30 indices was mentioned in Wright and Vetsigian 2016.
b) >50% of samples have less than the required number of reads (with threshold set below expected number of reads, expecting some loading variability)
c) <200M PF Clusters per lane (for Regular HiSeq run)
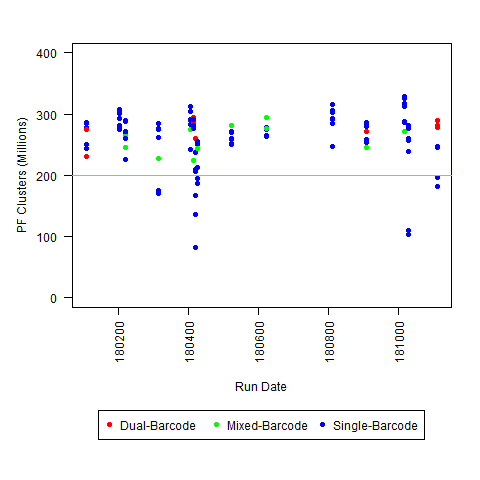
So, if you have any other similar observations, please leave a comment/answer! For example, these plots are all HiSeq 2500 runs (mostly Regular Run, with some Rapid Runs): we would be interested to know if this typical for that level of throughput (or if the severity of the I2 Q30 issue varies with overall throughput), and whether other people decided that any of the 3 criteria defined above was sufficient to define a run as “possibly problematic.”
Based upon feedback, I thought it might also be helpful to list relevant information that I think may help the discussion (if you are able to run a similar comparison; or, if you have other currently explained read loss):
1) Do you have Single-End (SE) or Paired-End (PE) samples (with at least some dual-barcoded samples)? I think the I2 Q30 values may be something more to watch on PE dual-barcoded runs than SE dual-barcoded runs.
2) What sort of sequencer are you using (MiSeq, HiSeq, NovaSeq, etc.)? Are you running it in any special mode (such as "Regular Run" versus "Rapid Run" for HiSeq)?
3) Do you have any runs with any of the following: drops in I2 Q30, large number of samples with insufficient reads, or total low PF cluster count? If so, do they seem to be associated with per-sample read loss (or anything else)?
I'm not sure what "Low" PF would be for all platforms (although I am saying <200 million reads is "low" for HiSeq 2500 regular run), so I you may have to use some of your other experience for that one.
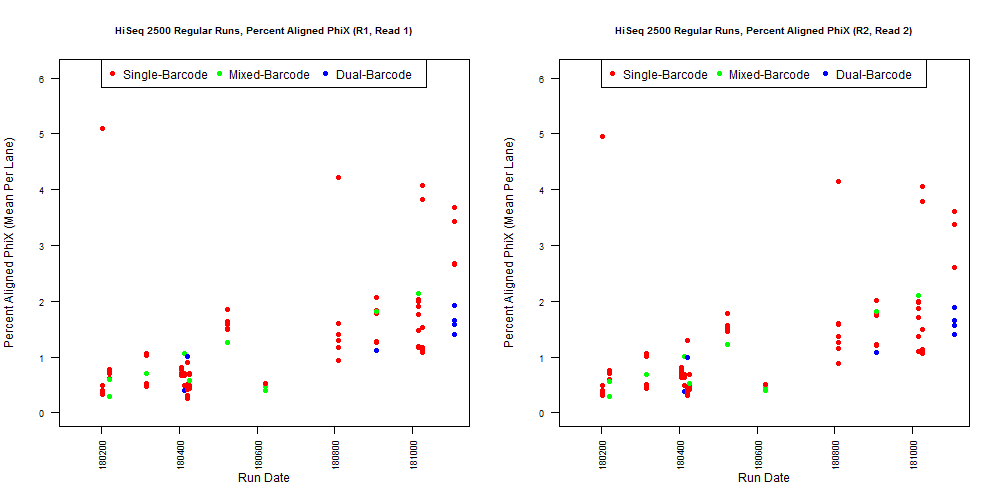
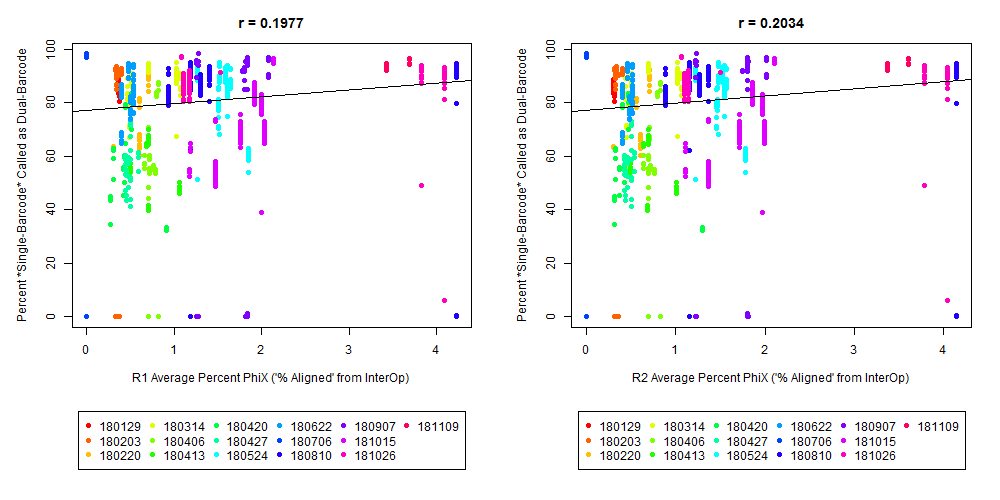
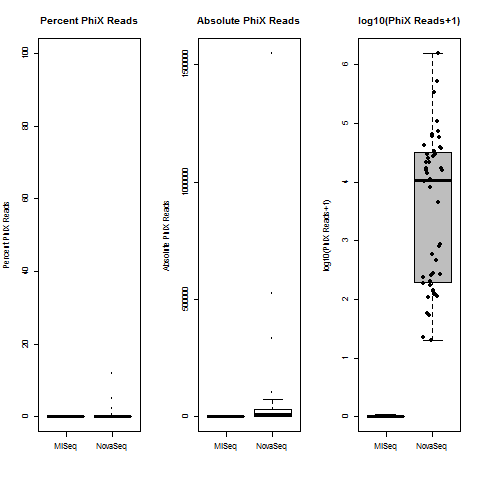
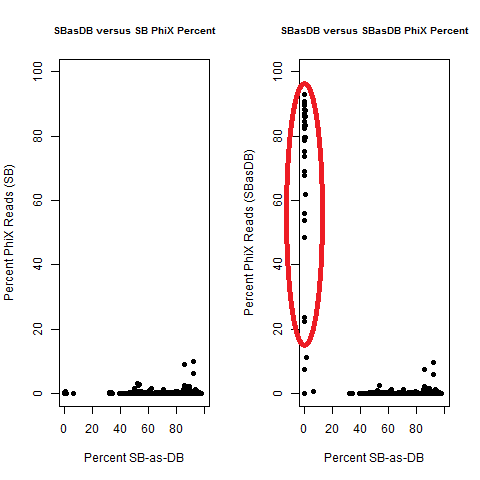
4) What is the average InterOp PhiX spike-in percentage per lane? (please see answer below for more information)
5) If at all possible, do you have experiences from multiple runs? It seems to me like this isn't something that would necessarily happen for every run, but you might notice something after testing several runs. I can't see a particularly problematic combination of samples in what I tested, but it's not beyond possibility that the type of sample (Amplicon-Seq, single-cell RNA-Seq, RRBS, ATAC-Seq etc.) might affect reproducibility for other people. I'm also not sure how often other people even have to have mixed barcode types in a run (which is the subset of runs that I am looking at).
6) Please double-check that you are using bcl2fastq with --barcode-mismatches 0
To be clear, I haven't found a problem in a specific project that I can attribute to the possible quality flags that I mention here. However, if you have some sort of weird low-frequency result, and you test creating index FASTQ files (to test additional filters based upon index quality scores), I think that may also be relevant (although that is not what I have done).
I also don't believe we had any completely dual-barcode runs, but the percent of unassigned reads (such as in slides #26-28) may still be relevant.


Can you explain how you did that? Did the samples have 2nd index all along but were run as single index?
Did you try doing two separate
bcl2fastqruns? Once for 1D samples and another for 2D?The "experiment" isn't exactly intentional, as least as far as I know, for most of the mixed runs. The only thing I know of that is like an experiment in that is sense is what I believe to be an empty lane on slide #2 (on left side of slide #11 and slide #27). So, overall, I think it might be better thought of as a retrospective study.
We sometimes need to process dual-barcode samples, but we usually don't have runs of all dual-barcode samples. Instead, they are usually mixed within a run (either within a lane or in different lanes per run).
So, in terms of normal procedure, we would return single-barcode samples to users called a single-barcodes, and dual-barcode samples used a dual-barcodes. However, at least until the .bcl files are archived, you can also go back and call the single-barcode samples as dual-barcode samples.
So, for the 1st half of the slides, I am taking about comparing the number of reads for a single-barcode sample, if you treat it like a dual-barcode sample (so, the percent is relative to the actual observed single-barcode reads, until of a starting desired number of reads; the percent expected reads is also important, but the best connection that I could find is what I show on slide #17).
So, there were originally two sample sheets (for single-barcode and dual-barcode).
For most of the results shown, I am adding information for the 2nd index in what was originally a single-barcode sample sheet (for
bcl2fastq).I'm not sure what I can say about some of the specific details, but here is a little more information about extracting the >Q30 Values (Per-Tile, Per-Lane):
When you create the imaging table, you have a
Readcolumn. If it is paired-end, there are 4 reads (1 is R1, like you might expect, 4 is the reverse read "R2", 2 is the 1st index, 3 is the 2nd index). If it is single-end, 2 is still the 1st index, 3 is still the 2nd index.There is also a column for
Lane(for these HiSeq 2500 runs, there are 2 lanes for a Rapid Run, and 8 lanes for a Regular Run)Each row will have a tile, and the information that I am extracting (to create the density of tiles per lane with ) is from the column labeled
%>= Q30.The Per-Tile Per-Lane Density Plots are created with code like this: