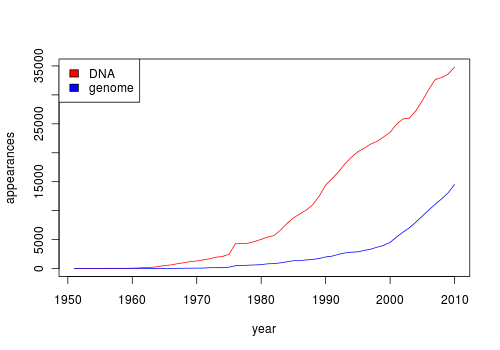
I am looking at a way to visualize distribution of a set of keywords over the years in PubMed. I am sure that there must be a tool to do that. An ideal solution will be similar to Google books Ngram Viewer. Here is an example plot using 2 key words.
Do you know about such a tool ? Please share !


This may be due to i) wrong publication date assigned to some google books entries ii) default smoothing of the graph. This is the case for a "peak" of 'bioinformatics' term use around year 1900 :-)
I think this is a great question but as a geneticist, I am puzzled by one aspect of that graph. It appears that google is showing citations for the word "gene family" before the word "gene" was coined. I can't think of a reason for this but it may be something to keep in mind when doing these searches.
SES & Jan thanks. I know the Google n-gram plot is not correct from a scientific context and this specific example have lot of false positive and low specificity :). The words could have come from different contexts, not exactly biology. You can click on the interval link given in that page to see the corresponding books that have these keywords.
Another issue with the Google data is incorrect values due to OCR errors (conversion of scanned documents to text). Frankly, I'm amazed at how little attention many people pay to n-gram data quality; it seems they are dazzled by the "big data" aspect.