Hi Chandan Kumar,
To plot data like this you can use karyoploteR, an R/Bioconductor package to plot data over the genome.
To plot on Arabidopsis thaliana you just need to install the BSgenome package for TAIR9 with
BiocManager::install("BSgenome.Athaliana.TAIR.TAIR9")
And the when creating the karyoplot add genome="TAIR9" and that will create a karyoplot for Arabidopsis thaliana.
Then, you can add your data using kpPoints or kpLines for example.
The code below
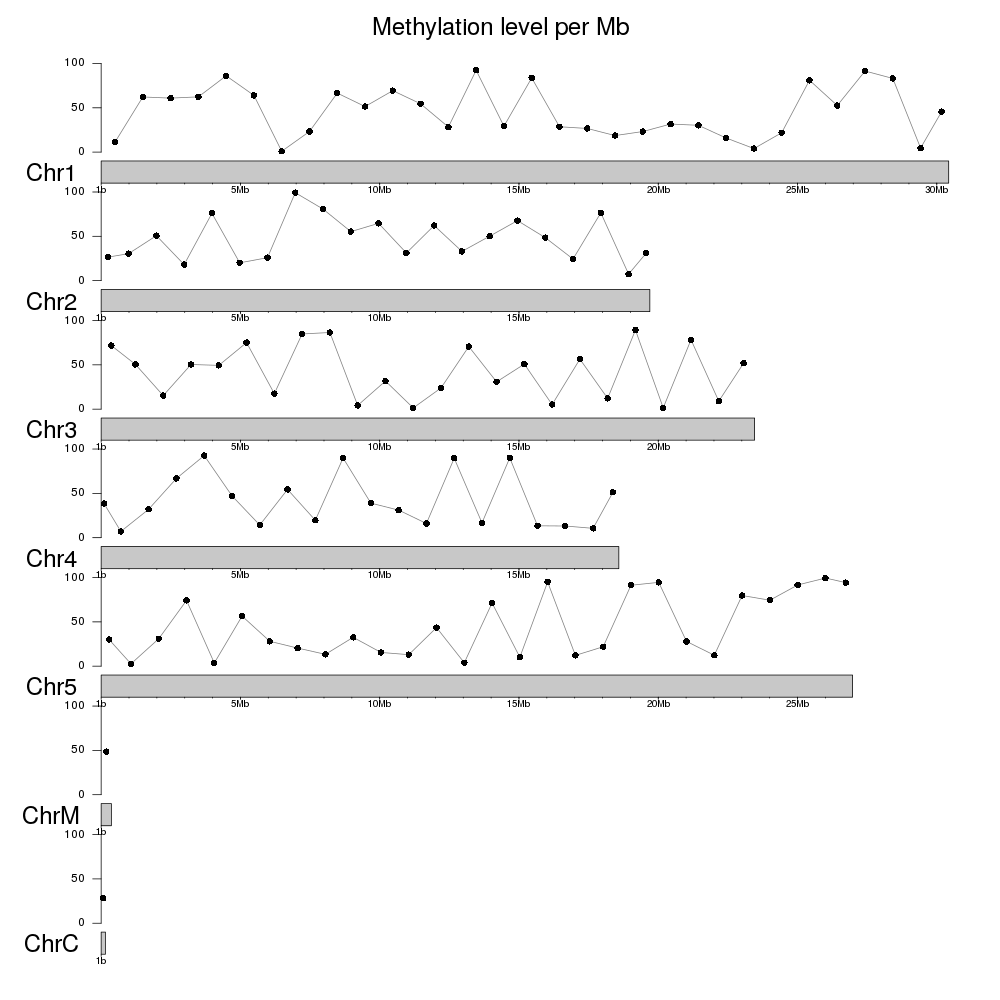
kp <- plotKaryotype(genome="TAIR9", main="Methylation level per Mb", cex=2)
kpAddBaseNumbers(kp, tick.dist = 5000000, minor.tick.dist = 1000000, add.units = TRUE, cex = 0.8)
kpLines(kp, data=cpgs, y=cpgs$mean.meth, col="gray50")
kpPoints(kp, data = cpgs, y=cpgs$mean.meth, cex=1.2)
kpAxis(kp, ymin=0, ymax=100)
would get you this image (with 1000 times more points! if you are using such small windows I'd remove the line).

You can customize the image however you want, add other data types and values and zoom in to plot only a small part of the genome. You can find more information in the karyoploteR tutorial
Hope this helps


Make .seg file and drag-n-drop it to IGV: https://software.broadinstitute.org/software/igv/SEG