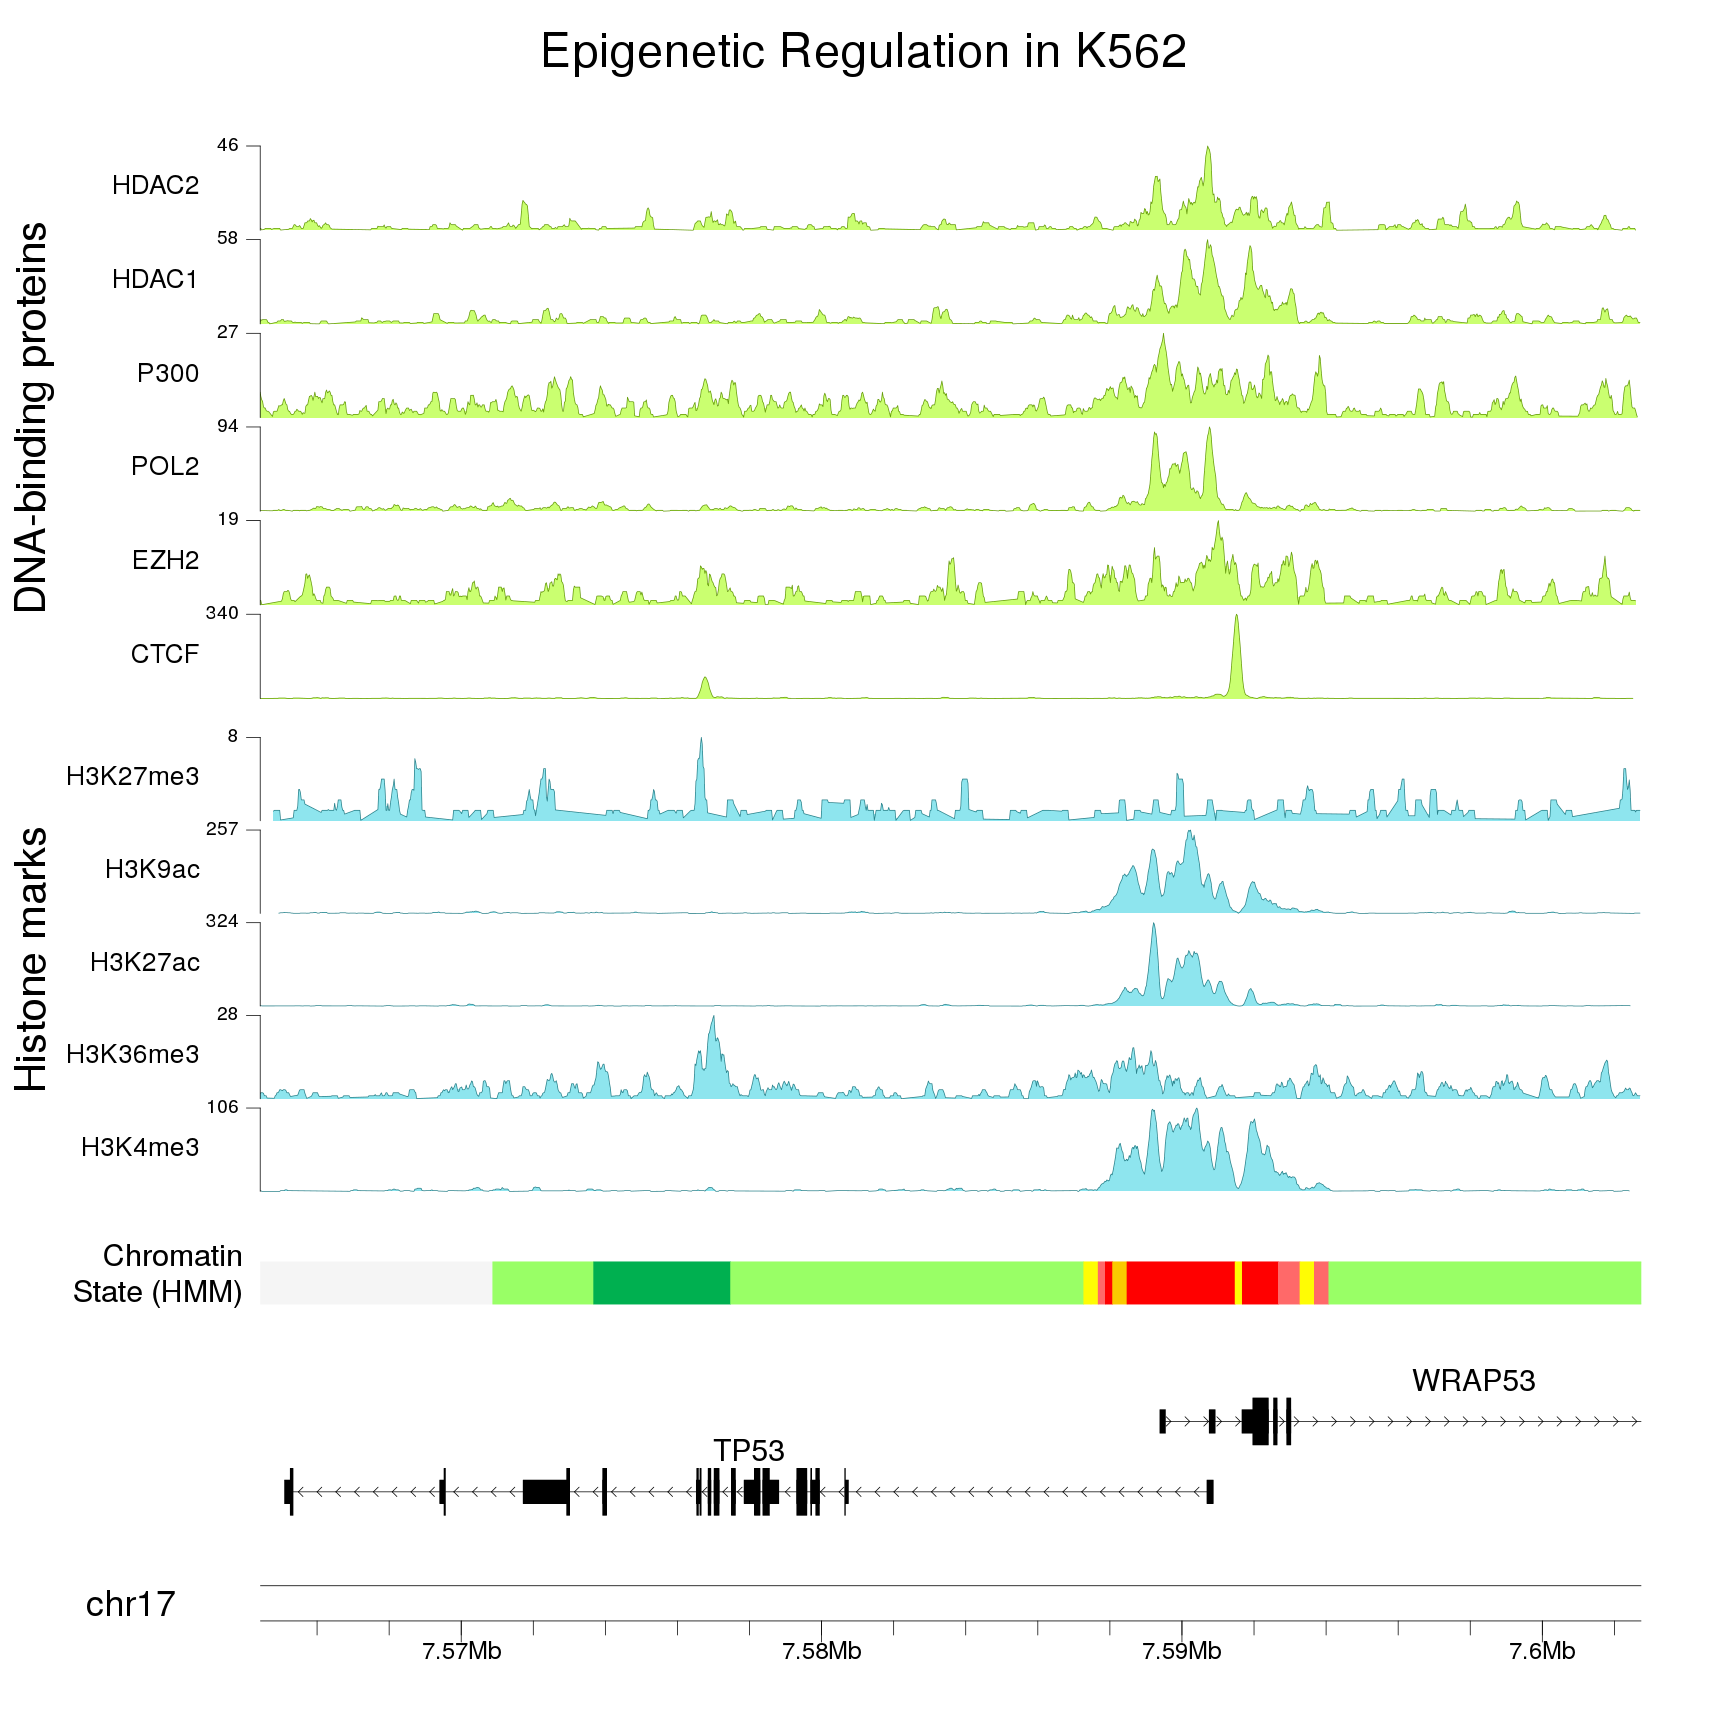
Hello, I am having a difficult creating a visual/ graph to represent my bedgraph. My bedgraph was made from intersecting a bed file (containing about 50 different contig names) with a bam file obtained from mapping small RNA with bowtie. I want to create a bedgraph plot with this information in R file.bg) to represent all the different contig. Is there a way I can do this or any better suggestion on what I can do?
Here is a few lines from my bg.
V2_5    124587  124588  1908
V2_5    124588  124589  1551
V2_5    124589  124590  1733
V2_5    124590  124591  1898
V2_5    124591  124592  2107
V2_18   834476  834478  424
V2_18   834478  834479  325
V2_18   834479  834480  205
V2_18   834480  834482  136
V2_18   834520  834524  55
V2_18   834524  834525  86
V2_18   834525  834526  87
V2_18   834526  834528  88
V2_25   2534300 2534302 240
V2_25   2534302 2534308 260
V2_25   2534308 2534322 263
V2_182  605998  605999  614
V2_182  605999  606000  590
V2_182  606000  606001  422
V2_182  606001  606002  335


If it's possible please provide a few lines of your bedgraph.
Have you checked Gviz tutorial?
https://www.bioconductor.org/packages/devel/bioc/vignettes/Gviz/inst/doc/Gviz.html#8_bioconductor_integration_and_file_support
I added a few line of my file to the post, hopefully that helps