Plotting Bedgraph with multiple chromosome
1
0
Entering edit mode
4.8 years ago
jaqx008 ▴ 110

Hello, I am having a difficult creating a visual/ graph to represent my bedgraph. My bedgraph was made from intersecting a bed file (containing about 50 different contig names) with a bam file obtained from mapping small RNA with bowtie. I want to create a bedgraph plot with this information in R file.bg) to represent all the different contig. Is there a way I can do this or any better suggestion on what I can do?

Here is a few lines from my bg.

V2_5    124587  124588  1908
V2_5    124588  124589  1551
V2_5    124589  124590  1733
V2_5    124590  124591  1898
V2_5    124591  124592  2107
V2_18   834476  834478  424
V2_18   834478  834479  325
V2_18   834479  834480  205
V2_18   834480  834482  136
V2_18   834520  834524  55
V2_18   834524  834525  86
V2_18   834525  834526  87
V2_18   834526  834528  88
V2_25   2534300 2534302 240
V2_25   2534302 2534308 260
V2_25   2534308 2534322 263
V2_182  605998  605999  614
V2_182  605999  606000  590
V2_182  606000  606001  422
V2_182  606001  606002  335
bedgraph Sushi R • 5.0k views
ADD COMMENT
0
Entering edit mode

If it's possible please provide a few lines of your bedgraph.

Have you checked Gviz tutorial?

https://www.bioconductor.org/packages/devel/bioc/vignettes/Gviz/inst/doc/Gviz.html#8_bioconductor_integration_and_file_support

ADD REPLY
0
Entering edit mode

I added a few line of my file to the post, hopefully that helps

ADD REPLY
0
Entering edit mode
4.8 years ago
bernatgel ★ 3.4k

Hi jaqx008

You should be able to plot it with karyoploteR, using a custom genome (with your 50 contig names) and probably kpArea to plot the data.

You should first load the data into R. You can do that with rtracklayer's function import

data.bg <- import("my.bedgrafile.bg", format=“bedGraph”)

If you are using a custom genome (your 50 contigs), you should create a file with the name and length of each contig and use it to create the karyoplot (more information in the karyoploteR tutorial)

kp  <- plotKaryotype(genome="your.genomefile.txt")

and then use a plotting function such as kpArea to plot your data

kpArea(kp, data=data.bg, y=data.bg$score, ymin=0, ymax=maxdata.bg$score)

At the karyoploteR tutorial there's more information on how to customize your plot and how to combine it with other data types.

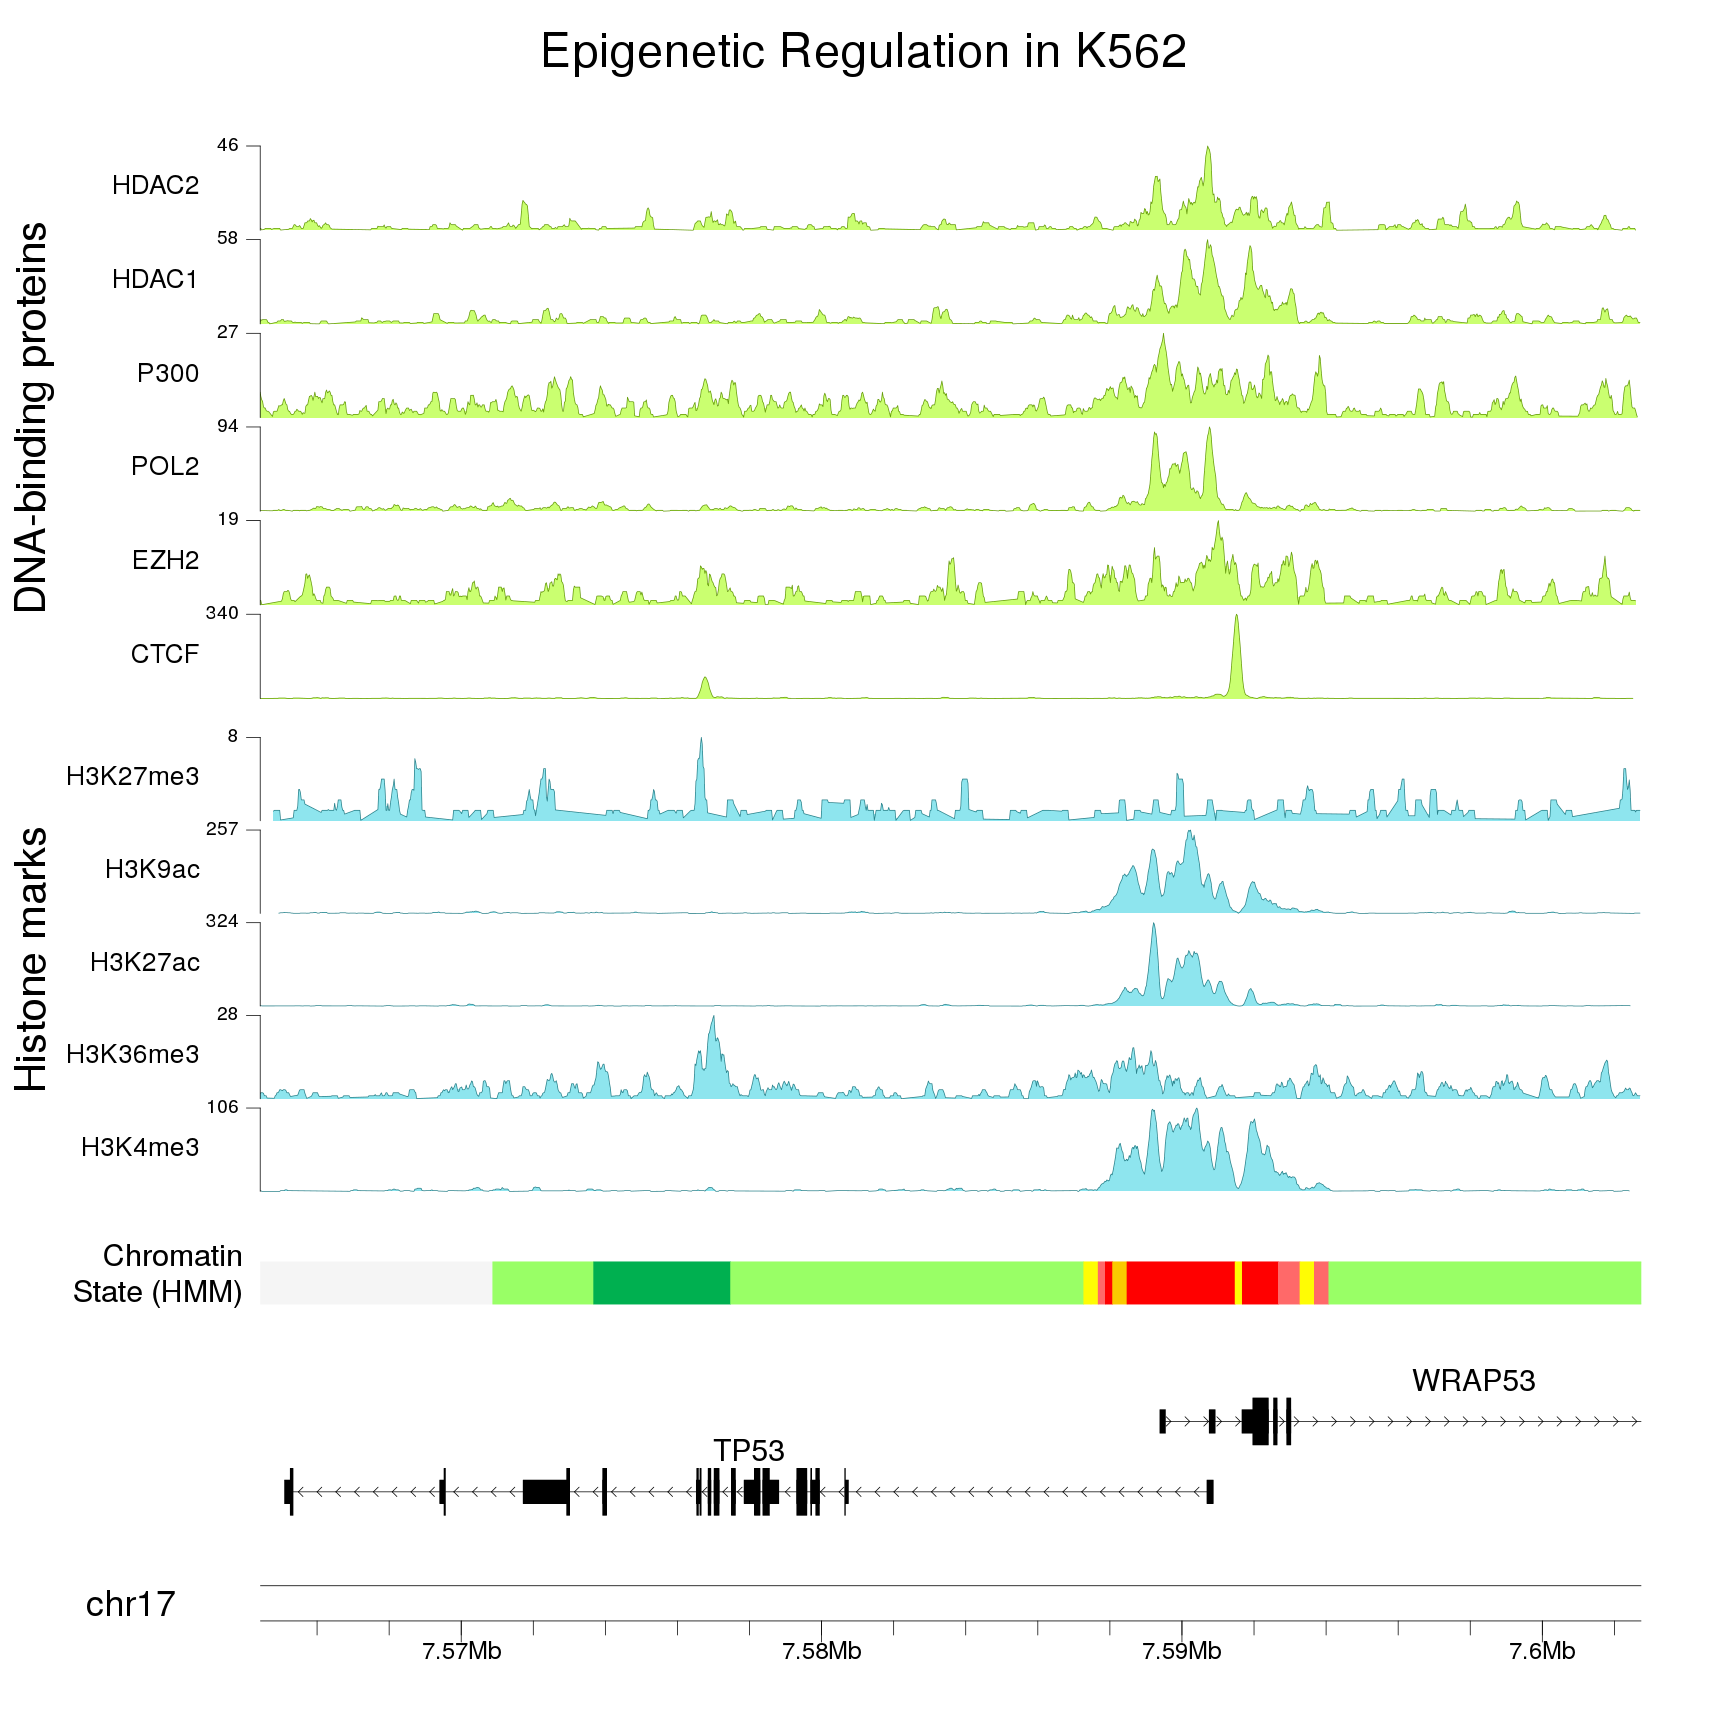
This is an example of the type of plots you can produce with kpArea (in this case it's plotting BigWigs, but the idea i the same!))

enter image description here

EDIT: Using a custom genome.

To use a custom genome you'd need to provide a tab-separated text file with 2 columns: the contig names and their length.

V2_5    124592
V2_18    834528
V2_25   2534322
V2_182  606002

With this, karyoploteR will treat each contig as a chromosome and will create the karyoplot for you.

ADD COMMENT
1
Entering edit mode

OK. I will look up the tutorial and post how it went later.

ADD REPLY
0
Entering edit mode

Cant seem to be able to use my genome format as it is not a custom genome and I cant find an example that uses just a bedgraph information such as (chr start end score).

Is there a way I can use my own genome and not custome one? the custome genome seem to have information not found in my bg

ADD REPLY
0
Entering edit mode

Hi @jaqx008, When I said custom genome I was referring to your own genome. I've updated the response to include a bit more of information on how to do that. Hope this helps! Bernat

ADD REPLY
0
Entering edit mode

That makes so much sense. The problem I am encountering right now is loading the file in R. I think after installing and loading the karyotypeR library and running the first command I get "could not find function 'import'" error. also format="bedgraph" dont seem to be recognized. I install import thinking that might be the case but still get the error. Any ideas what could be the problem?

ADD REPLY
0
Entering edit mode

You need to install and load rtracklayer

BiocManager::install("rtracklayer")

and

library("rtracklayer")

and then import should work.

Also, it's "bedGraph" with a capital "G"!!

ADD REPLY
0
Entering edit mode

Thanks for your help. I am still unable to do this even after installing rtracklayer. The bedGraph wont come up except I type it and I still get error.

> data.bg <- import("34regions.bg", format= "bedGraph")
Error in scan(file = file, what = what, sep = sep, quote = quote, dec = dec,  : 
  scan() expected 'an integer', got 'Start'
ADD REPLY
0
Entering edit mode

Oh, I see the problem. bedGraph files are not supposed to have a header. If you delete the first line in your file it should work right away.

Another option would be to use toGRanges from regioneR.

data.bg <- toGRanges("34regions.bg")

it should load the data without any problem, but with a bedGraph you'll have an off-by-one errror (your regions will be 1 base too long). You can ignore this (it should not affect your plots at all) or correct it with

start( data.bg) <- start( data.bg) + 1

And you should be ready to plot!

ADD REPLY

Login before adding your answer.

Traffic: 2144 users visited in the last hour
Help About
FAQ
Access RSS
API
Stats

Use of this site constitutes acceptance of our User Agreement and Privacy Policy.

Powered by the version 2.3.6