Entering edit mode
4.8 years ago
danielmatsusaka
•
0
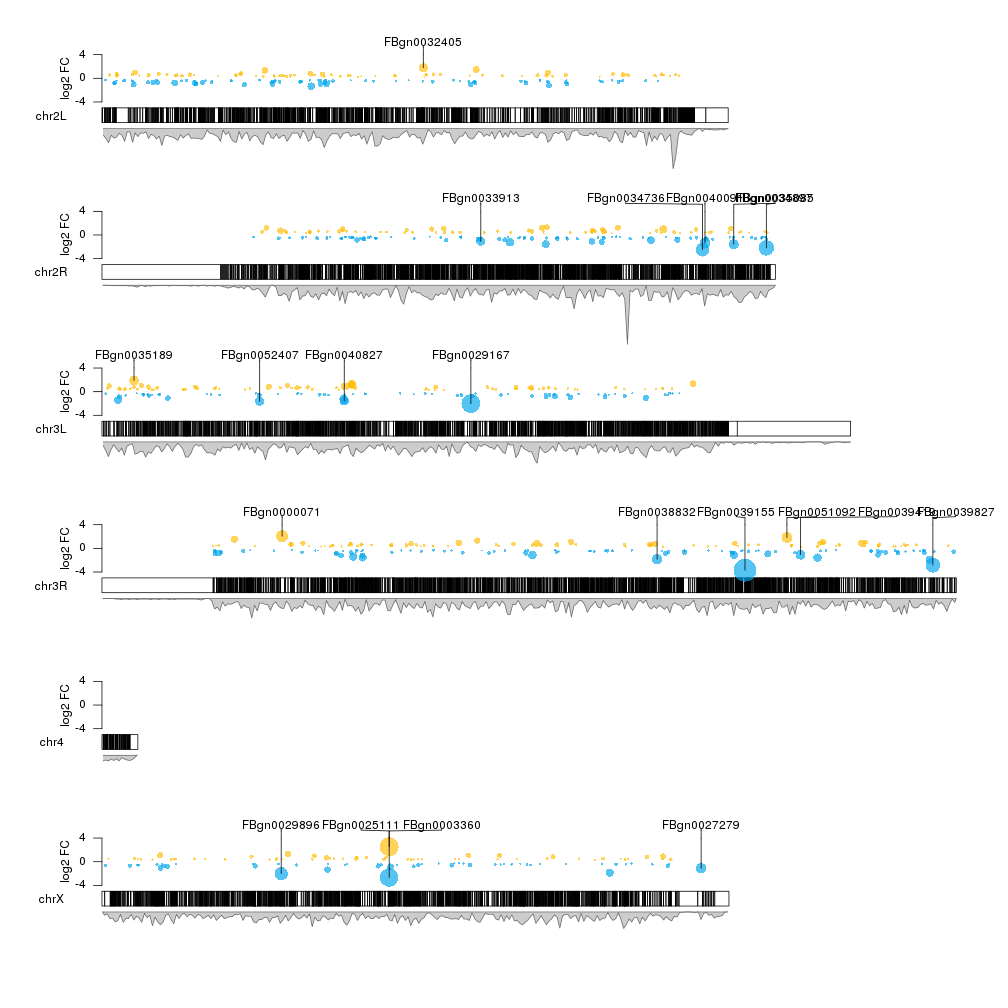
how I can create one plot using this data for more than one chromosome?
1. CHR  Marker_ID   A   B   FRECUENCY_A FRECUENCY_B
 2.  1              0                  120  163 0.424028269 0.575971731
 3.  1        28511        138  179 0.43533123  0.56466877
 4.  1        80849        132  184 0.417721519 0.582278481
 5.  1        131493           134  188 0.416149068 0.583850932
 6.  2        174364             134    167 0.445182724 0.554817276
 7.  2             227341          140  174 0.445859873 0.554140127
 8.  2         489290          125  154 0.448028674 0.551971326
 9.   2        519811          141  166 0.459283388 0.540716612
 10. 2            546093           141  169 0.45483871  0.54516129
 11. 5           0                 111  165 0.402173913 0.597826087
 12. 5          10574371    128 186 0.407643312 0.592356688
 13. 5          24590938    110 162 0.404411765 0.595588235
 14. 5          25139346    117 169 0.409090909 0.590909091
 15. 5          25453449    118 174 0.404109589 0.595890411


Can you please link us to an example of a 'genetic marker frequency plot' ?