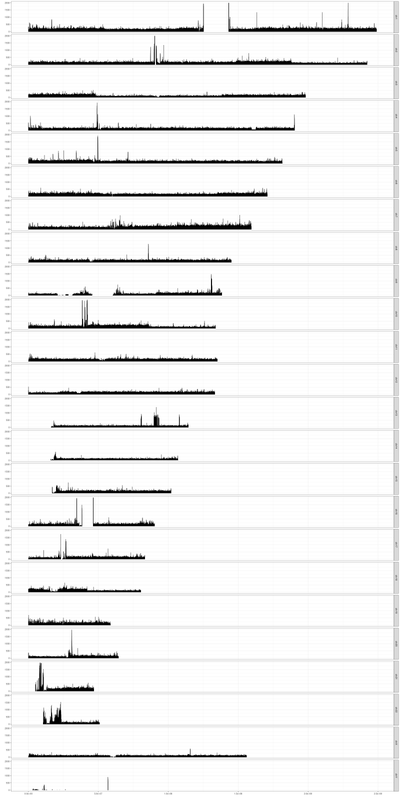
I am running a Bisulphite seq data analysis using six samples with three conditions (two samples per condition).
The mapping was done using bismark against the CG-converted genome needed by the tool. The coverage plots ere done using the R package RnBeads when analyzing the samples using their pipeline.
As one can see from the plot below, for some of the chromosomes the distribution of reads is quite normal over all the chromosome, but for many of them the mapping was only in specific regions. After looking for similar results, i would like to understand if this is something one would expect to happen, or do i have a problem here. if so, can someone please tell me what to look for?
Unfortunately I can't really be sure, if the coverage i see here, is something i should expect to see, or if this is anormal.
thanks in advance


