Entering edit mode
4.5 years ago
citronxu
▴
20
hello there,
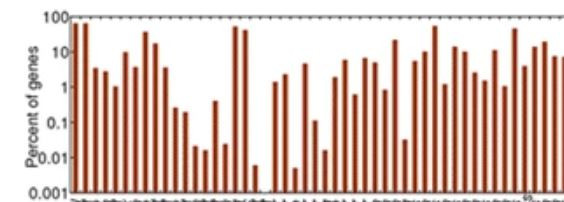
Since the values of different groups in my dataset are quite different (some are reaching hundred times larger than others), I'd like to creat a bar chart that could beautifully plot and display all data points with bars of similar height/length, for which uneven value interval in the axis should be set.
Right now I'm using barplot package, yet don't know which parameter I should specify to meet my goal. Or is there any other easier-manipulating packge able to be used in R? Welcome any suggestion.
Many thanks in advance.


