Hey everyone,
I've been trying to generate two Manhattan plots of different data sets to compare. However, one problem I'm facing with e.g. qqman and other R plotting scripts I've tried is that the plots don't align when e.g. overlaid (which is quite visible, as the boundaries of the single chromosomes are shifted). I assume this is because e.g. in data set 1, chromosome 1 contains data points from a certain positional range, whereas this range might be smaller or larger in the second data set. I've not been able to find a script that would allow me to set this range.
Is anyone aware of any Manhattan plotting software, scripts or packages that would be able to do this?

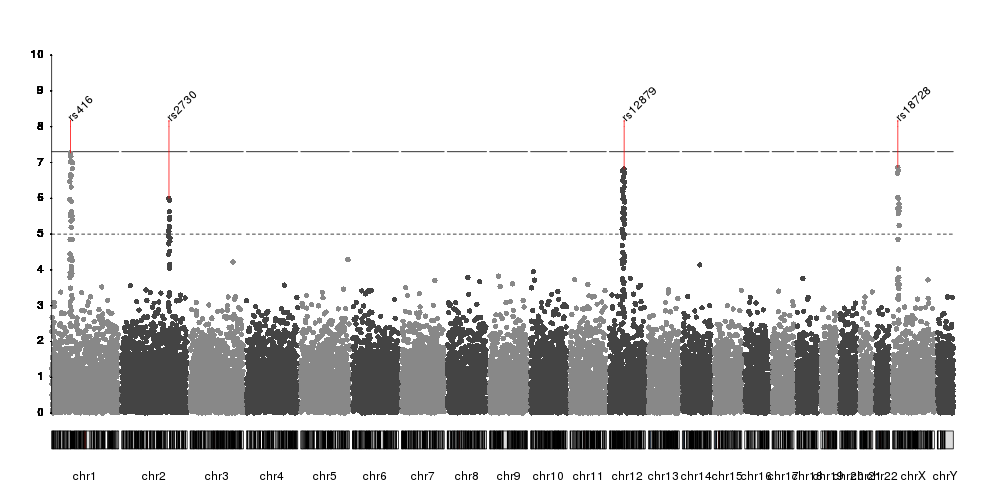

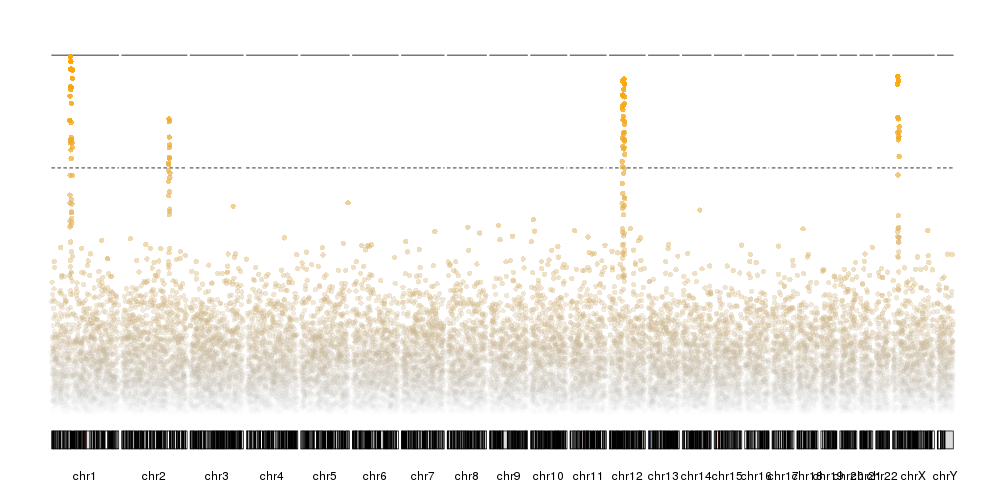
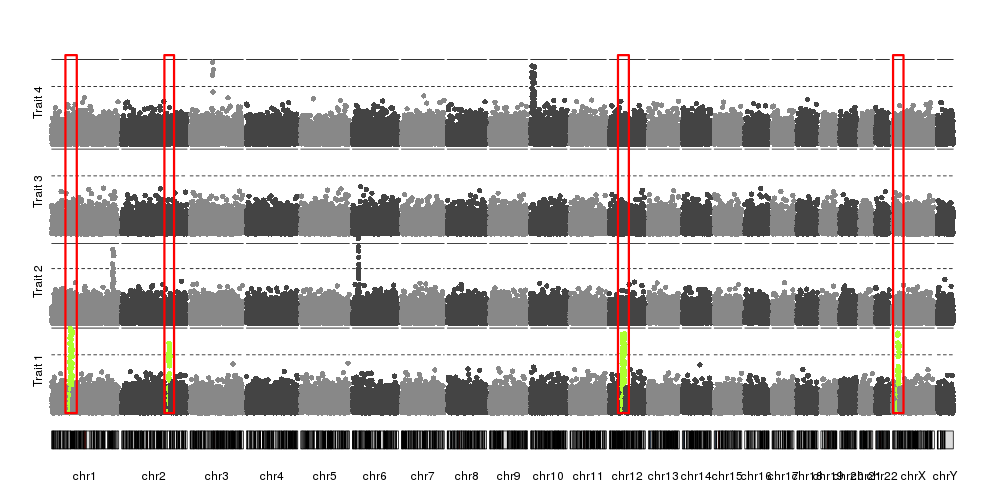
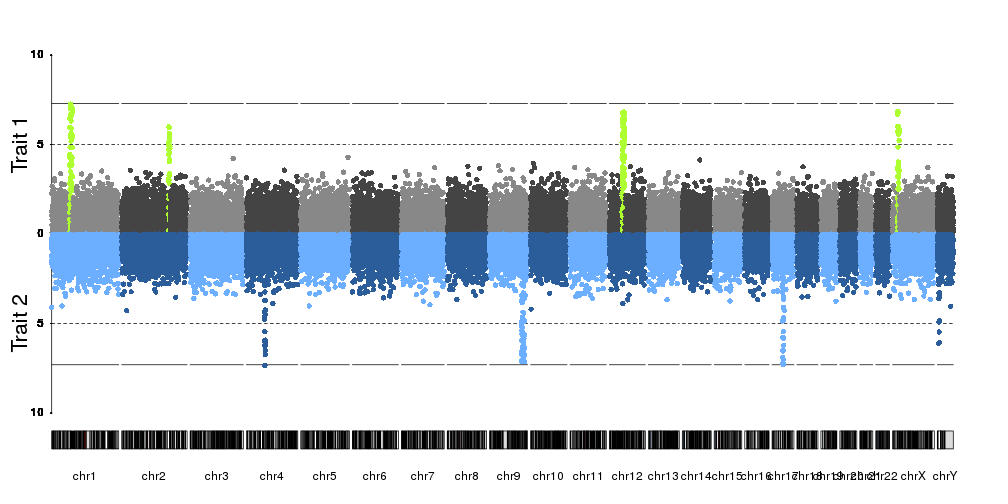
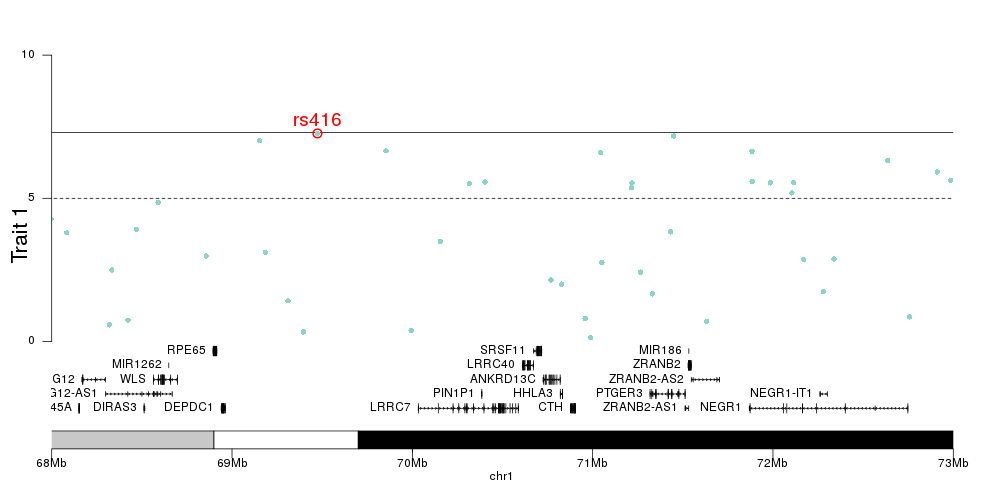

You might be able to plot this using a swarm plot from seaborn. This will pull y-values from a pandas dataframe column and give you something similar to what you want. You can also easily set the width that you feel your points need to stay between
Can you share the problematic plot? I have trouble imagining the issue and I would think that most necessary tweaks could be achieved in
qqman