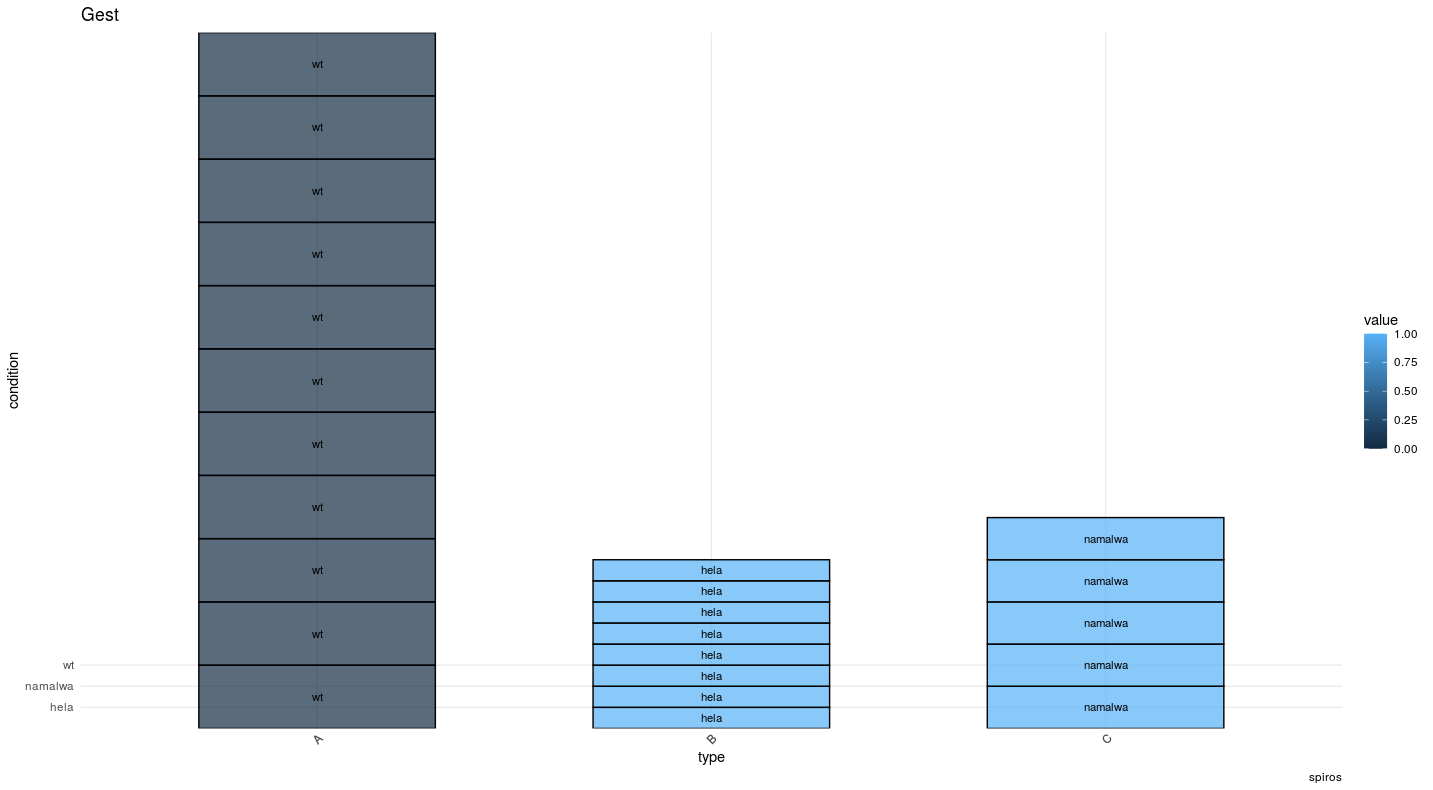
hi all, trying to create a stacked barchart. But i dont understand why the "blocks" have different sizes for each category (A, B, C) and why the y axis labels are only 3 and low down.
p<-ggplot(data = example, aes(x=type, y=condition, fill=value))
p + geom_bar(stat = "identity", width = 0.6, color = "black",size = 0.5,alpha = 0.7) +
  theme_minimal() + theme(legend.position = "right", axis.text.x = element_text(angle = 45, hjust = 0.8)) +
  labs(x= "type", y = "condition", title = "Gest",caption = "spiros")+
  scale_x_discrete(limits = c("A", "B","C")) +
  geom_text(aes(label = condition), position = position_stack(vjust = 0.5), size = 3)
data i used :
type    value   condition
A   0   wt
A   0   wt
A   0   wt
A   0   wt
A   0   wt
A   0   wt
A   0   wt
A   0   wt
A   0   wt
A   0   wt
A   0   wt
B   1   hela
B   1   hela
B   1   hela
B   1   hela
B   1   hela
B   1   hela
B   1   hela
B   1   hela
C   1   namalwa
C   1   namalwa
C   1   namalwa
C   1   namalwa
C   1   namalwa

https://freeimage.host/i/2JU6gV


What are you imaging the final plot to look like? Right now it's not clear how you want value to be represented in your plot.
Like the one i uploaded but with same "block" sizes. I dont understand why the sizes of these "blocks" change randonmly (or not - i dont know) and how i can make them all the same size.