Hi, may be comeone can clarify the following things:
I have a 10x data, which I processed through the cellranger pipeline counting and aggregating samples.
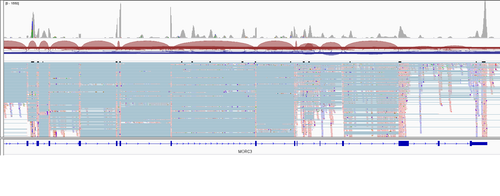
Apart from the count matrix etc. cellranger produces .bam file which I inspected in IGV. As far as my understanding goes 10x should give me the reads only on one end of the transcript (polyA - poly T praimers). But I a) see the reads all over the different exons and b) sometimes they are poorly alligned with any known exons. I'm even not sure how it is possible to get such coverage data from 10x?

Best, Eugene


Hi, thanks for the answer - but still, there have to be a step of the fragment size selection is it no true? So "all" R2 reads have to be more or less at the same distance from the polyA? (not counting these 10-30% of R1, which were mapped somewhere else in the transcript) So I, at least, supposed to see a two very strong coverage peaks.
the insert sizes can be anywhere from 200 to 1000 bases long. It's not really expected for the fragments to be the same size.
One-thousand is a bit much I think, but the point stands, isize can be dynamic and mispriming can happen. Remember that RT is done at low temperature so it is not like a regular PCR where you can actually super-fine tune your annealing temperature. Here is for example how the fragment size distribution (based on Bioanalyser), so the actual fragment that is loaded on the sequencer (incl adapters, UMI,CB) looked like in our last run. cDNA is therefore a bit shorter than that.
Yes, I agree that 1000 is too much, but my point is also stands :) Here is the snapshot from the video from nanopore site (2:47 nanopore):
And the guy there, tells exaclty what I'm trying to say - usually you have a huge peak close to 3' end and a litle bit over the rest.
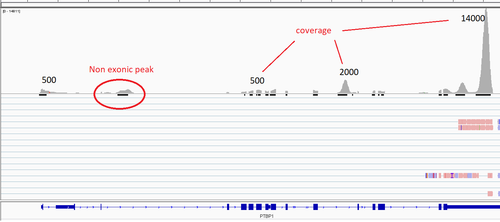
Here is the same gene from my data:
It looks more or less the same, also, as far as the expression is super strong, even minor peaks have quite good coverage. Also it can be notticed that they ideally overlapp with the exons. That is probably tells me that all mRNA of the given gene is spliced. But still, where such a long reads comes from so I can read the sequeince of the _first_ exon???
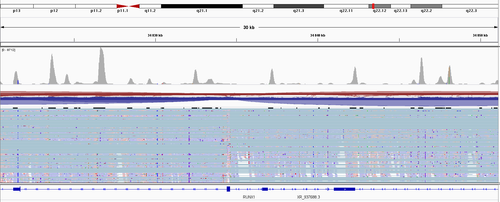
And here is the gene (second picture from the initial post) I'm actually interested in (I was asked to try figuring out what is going on with its isorofms expression)
It can be seen that a) peak heights more or less uniformly high over the gene length AND b) peaks do not correspond to exons. How is it possible given the 3' sequencing protocol?
After some additional search I think here is the doc I was looking for 10x offtargets
But I'm still impressed by my data)) :