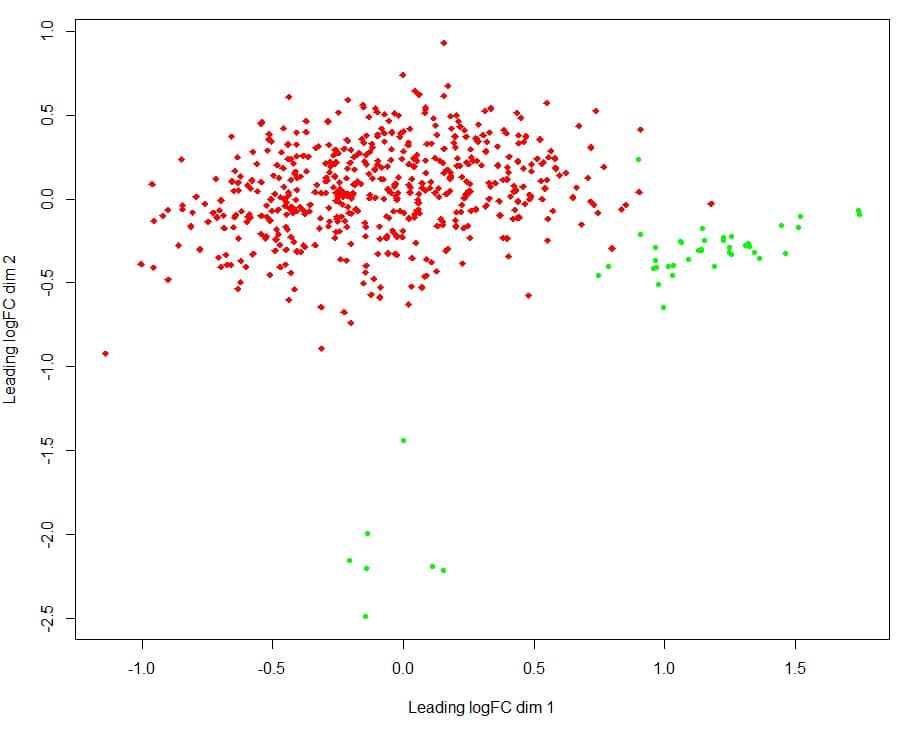
Hi, I downloaded microRNA expression data from TCGA (Isoform Expression Quantification files) using the TCGAbiolinks package from Bioconductor. Now I made a MDS plot using limma package function plotMDS but I have a weird distance between samples of same group (normal tissue group) and called it outliers (I don't even know if it really is), the dots on bottom of the plot.  red dots represents tumor samples and green dots represents normal tissue samples
- How can I find out the sample IDs of these outliers? each dots corresponds to a sample of a DGElist object from which the MDS is made.
- Should I remove these samples from my analysis?

