Entering edit mode
3.9 years ago
grx0326
▴
20
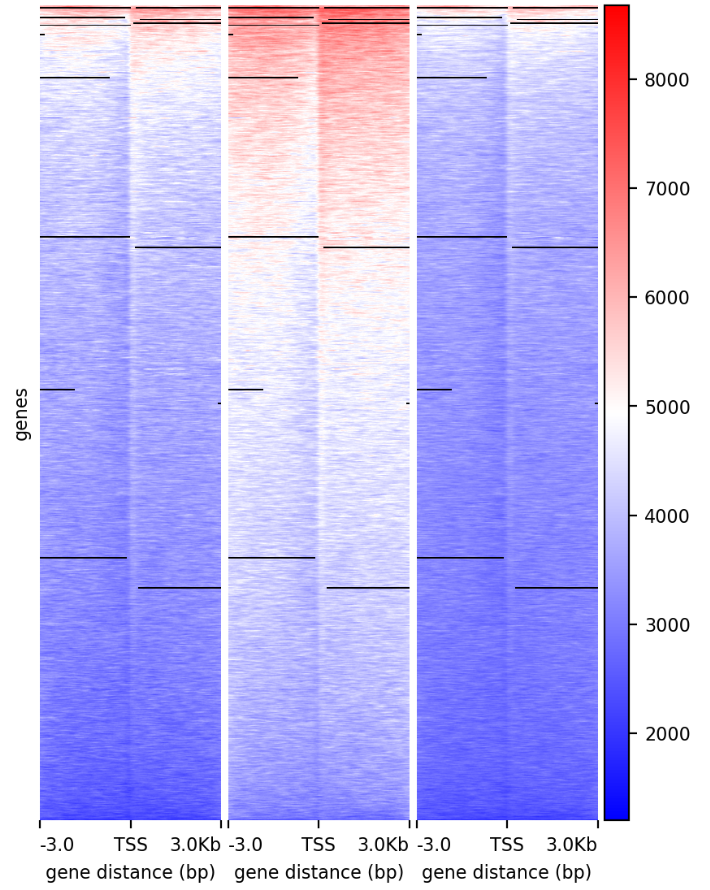
I have been using deeptools plotHeatmap to generate heatmap around TSS regions from my chip-seq data.
However there are black lines in my heatmap and I don`t know what those lines stand for.
Here is my code:
plotHeatmap -m [prefix]matrix.gz -o [prefix]normalized.png --boxAroundHeatmaps no --colorMap bwr --heatmapHeight 15 --heatmapWidth 3 --whatToShow 'heatmap and colorbar' &
And here is what I got:

Any ideas are appreciated


you mean change the black line into other color?I am not sure how to achieve that
It's the
--missingDataColoroption, see the online help page for more information: https://deeptools.readthedocs.io/en/develop/content/tools/plotHeatmap.html