How To Add Additional Panes To A Clustering Heatmap Plot Created With R
2
1
Entering edit mode
11.5 years ago

Hi Folks,

I am performing Hierarchical Clustering in R and wish to add two additional panes into the heatmap to indicate two things: 1. The subtype relating to the sample 2. An activity value which is scaled from 0-8

I have been looking into RowSideColors and I can manage to get the display I wish but instead of highlighting the subtypes it simply colors each sub Cluster! something along the lines of this (Image a) with the legend
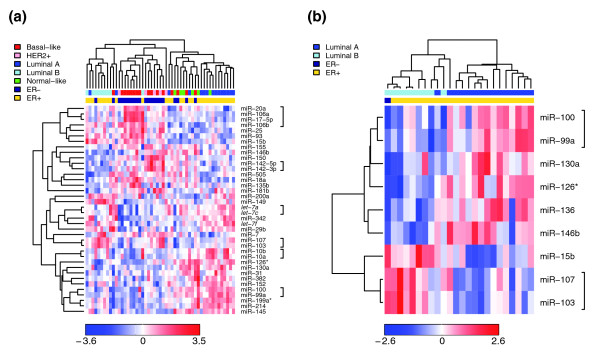
enter image description here

r heatmap • 18k views
ADD COMMENT
0
Entering edit mode
ADD REPLY
1
Entering edit mode
11.5 years ago

Have you read How Do I Draw A Heatmap In R With Both A Color Key And Multiple Color Side Bars? which describes how to add multiple color side bars. You can add any number of color side bars which highlight row/columns in any arbitrary way.

ADD COMMENT

Login before adding your answer.

Traffic: 2687 users visited in the last hour
Help About
FAQ
Access RSS
API
Stats

Use of this site constitutes acceptance of our User Agreement and Privacy Policy.

Powered by the version 2.3.6