Hi!
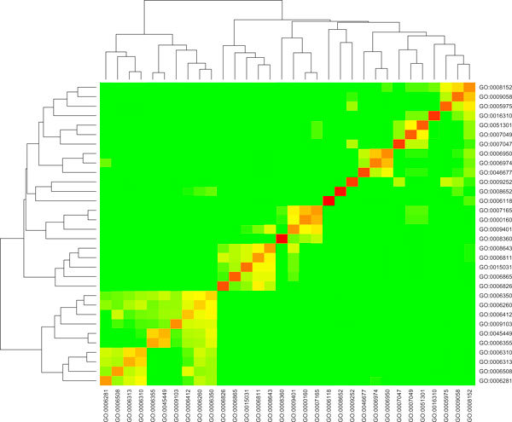
Does anyone knows how to generate heatmaps of significantly enriched pathways/GO terms?
like the one here : http://openi.nlm.nih.gov/imgs/rescaled512/3009538_1471-2105-11-S1-S64-1.png

Something like this, but not exactly like this ;)
note: I have list of genes, and ofcourse some kind of correlation needs to be calculated either based on number of genes enriched in each term or p-values of terms.
Thank you


Is this a correlation plot? What do you have in your x axis? I assume, you will need samples!! Could you explain a bit more about your data?
you can also use
corrplotpackage!!!