What is best online tool for calculating power analysis (stat) of RNAseq experiment design? I know about Scotty but it based on another closely related data and may not provide actual scenerio.
Thanks
What is best online tool for calculating power analysis (stat) of RNAseq experiment design? I know about Scotty but it based on another closely related data and may not provide actual scenerio.
Thanks
Hi Honey,
I wrote Scotty so maybe I can shed more light.
By "closely related samples" we mean that you have to have some data that can be used to make a reasonable estimate of the variability you expect to see between replicates in your data. If there are other methods that purport to do a power analysis without doing this then they may be just making stuff up. This is because any power calculation requires: the false positive rate, the magnitude of the change, and the variability between measurements. The first two you can set. The variability you have to measure.
By "may not provide actual scenerio" I think you must be referring to the warning labels. We put these in to appease reviewer 3, no wait, I mean we put these in to warn our users that power analysis is difficult and if the samples have higher than expected variability then your power estimates can be wildly off. For example, partially-degraded or low input clinical samples have a lot more technical variability than samples freshly out of a cell line, and if you try to predict the behavior of clinical samples from cell line data you are going to have an under powered experiment. But if your samples have similar variability to your experiment, as you would get from pilot data, the predictions work well.
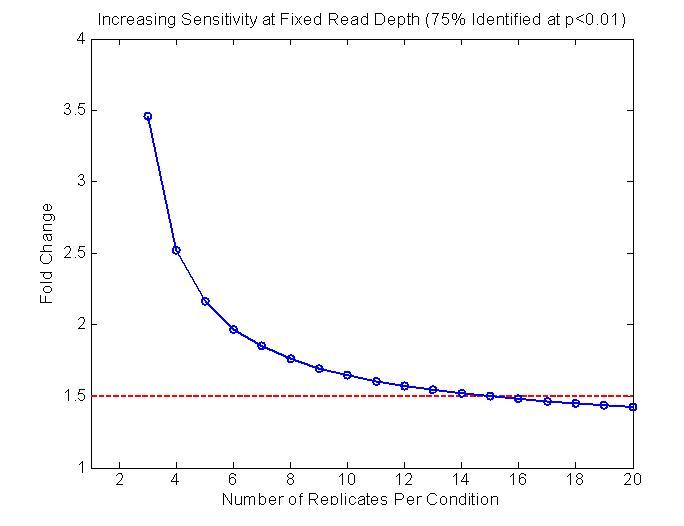
But for easy experiments the variability in the biological replicates was around 30% over-dispersed from Poisson for several experiments. I did this chart for a talk last week, based on that and our methodology. It might be helpful. It shows the predicted power based on a typical well-measured gene (1000 reads total). The total number of reads is fixed. They just get divided into more replicates.

For microarray analysis, I use the OCplus package (although I realize this may not be ideal for RNA-Seq):
http://www.bioconductor.org/packages/release/bioc/html/OCplus.html
In general, I am typically skeptical about statistical power calculations - there are so many variables, it is very hard to tell how the results will turn out. I would advise just picking a method (like Scotty) to make some estimate that justifies including X samples to be able to detect genes with greater than Y fold-change. In reality, I would recommend getting as many patient samples as you can get your hands on (I prefer public data sets with at least 100 patients per cohorts), triplicates for cell line studies, and somewhere in between for animal models (I would recommend at least 6 replicates per group for mouse model studies).
Michele ,
How you fixed the no of read and vary replicates reads- putting 1000 in option -- 'Assess the power of sequencing depths between and reads aligned to genes per replicate'
?
Hi Honey,
I sent you an email but because other people might wonder:
I made the graph separately in Matlab using the formulas I developed in the Scotty paper, specifically, if you look in the supplement:
http://bioinformatics.oxfordjournals.org/content/suppl/2013/03/06/29.5.656.DC1/btt015.pdf
I used:
Equation 11 which shows how you can independently calculate the non-poisson over dispersion
and
Equation 12 which is the power analysis formula from Chow et al 2002 which get the power related to the variance and the mean.
The charts in Scotty display the data differently. I did not think of displaying the data that way until a couple weeks ago, though it seems like a useful way of looking at it. Maybe if I have time I'll add it something like that to Scotty so people can fiddle around with it.
That is only the power for a particular, typical gene. The true power of the experiment may be different because a mix of genes will have a mix of variances, e.g. some genes will reproduce more poorly.
Use of this site constitutes acceptance of our User Agreement and Privacy Policy.
I agree with your observation, I myself has reservation id doing such test but reviewers just keep on hitting this. So I though I would check on that in the forum. Any feedback from other colleagues if I can use tool for GE for RNA-seq?
Thanks