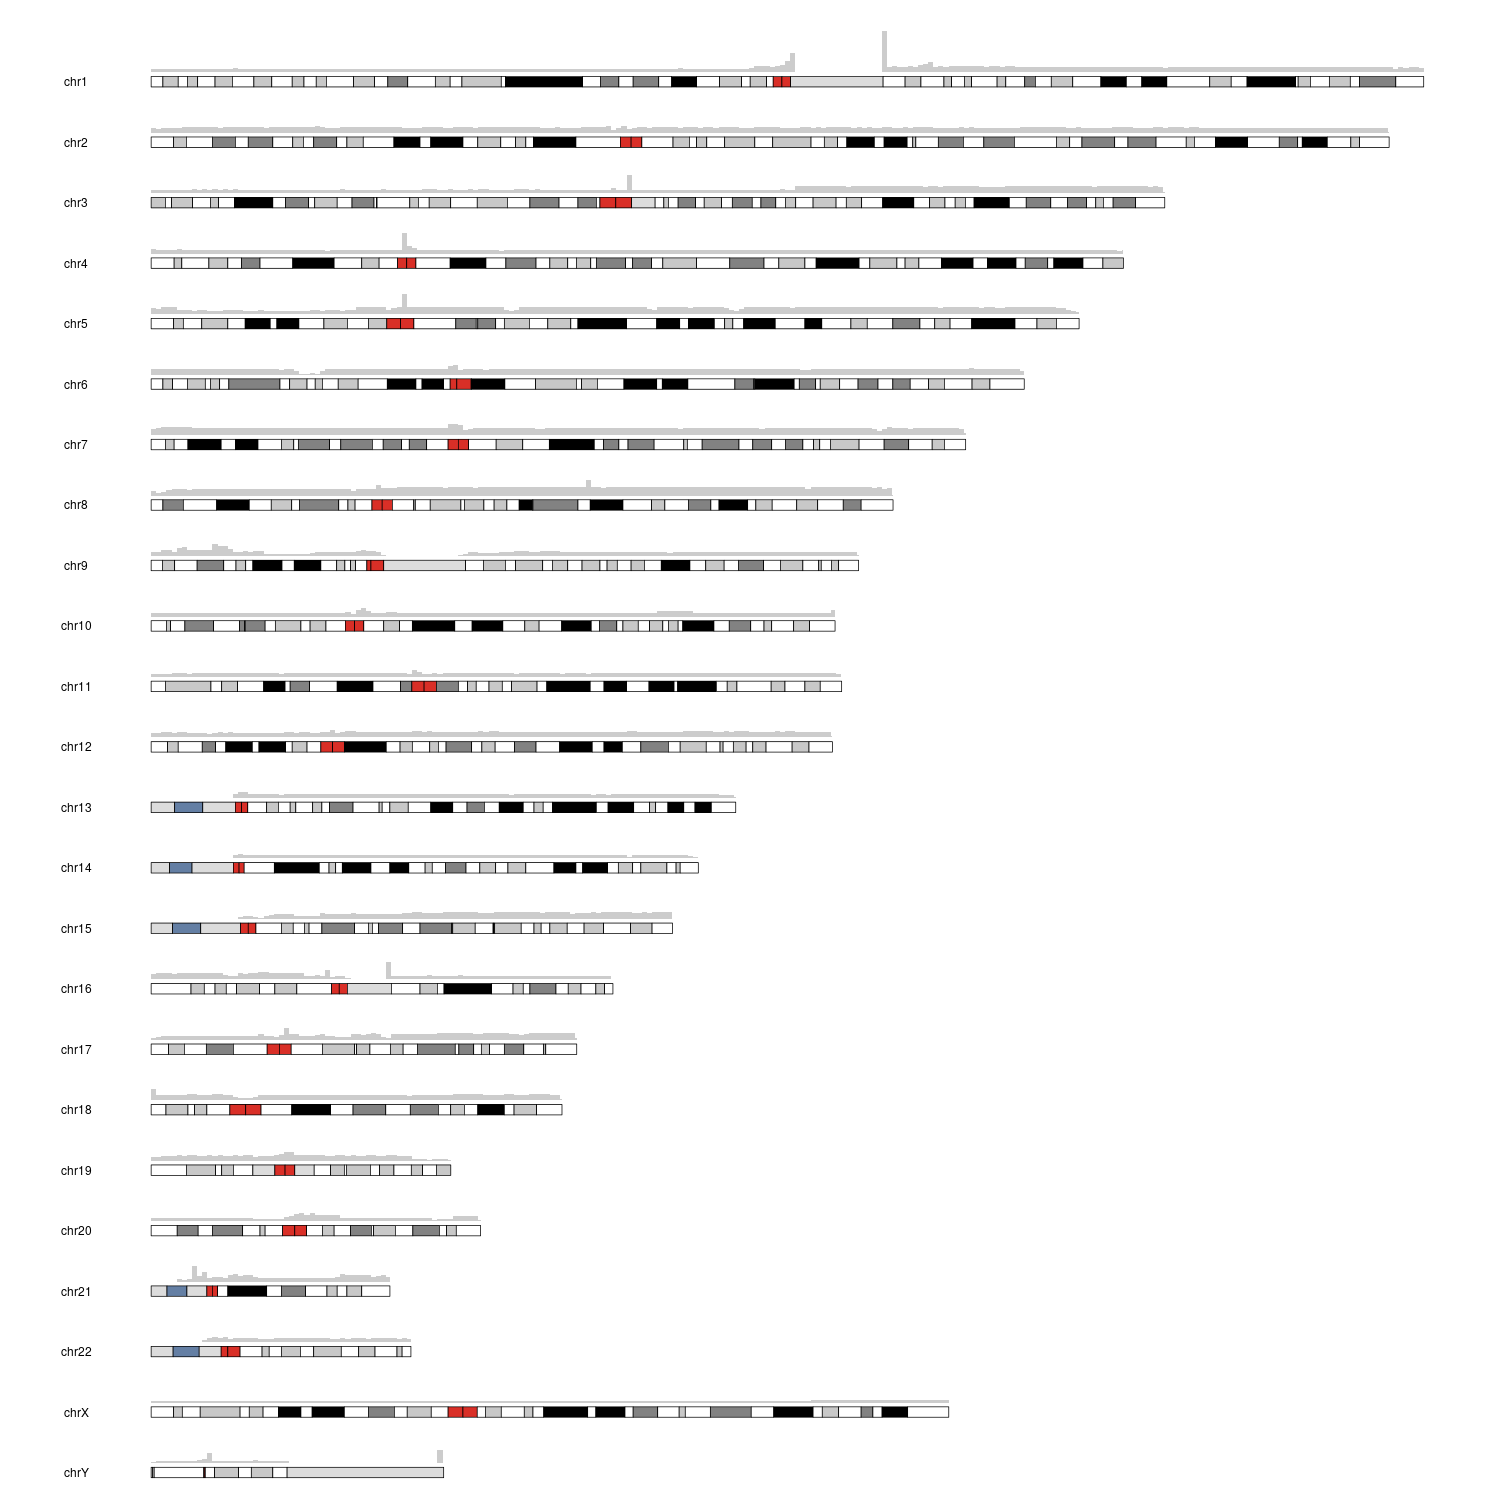
Heys,
I'm working with whole-genome sequencing data and I already did the alignment and I have my bam files. I calculated the coverage per genome position of those bam files with bedtools:
bedtools genomecov -ibam file.bam -d > coverage.txt
My problem is that coverage.txt is 50GB. I tried to visualize this with R in the cluster but it runs out of memory. So my doubts: do you know how could I reduce the size of this file? Maybe there is a better way to calculate and visualize genome coverage?
Any help would be appreciated!


You can try to divide and compute mean coverage for regions instead of trying to visualize individual positions. You can find some other ideas here.
Thanks for your answer, the problem is that I don't have identified regions yet, so it would be problematic