Hello Biostars Community,
How to quickly and precisely, find and filter coexpressed markers with one specific gene of interest in scRNA-seq data?
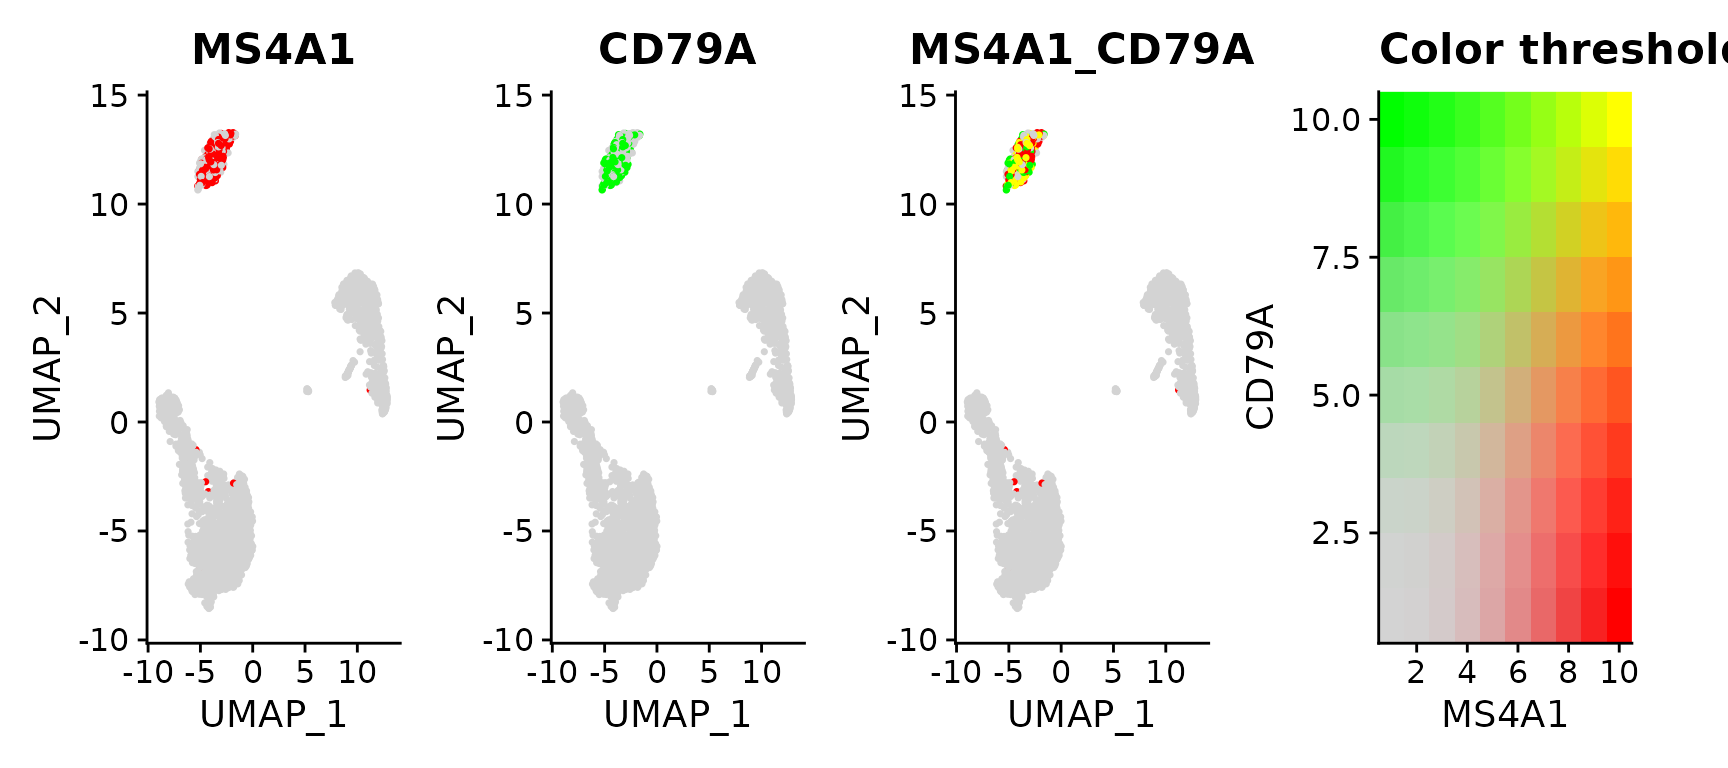
Is there a way to do this, without making a gene-gene correlation matrix (takes wayyy too long)... Using Seurat's pipeline for clustering often just groups together cells with similar expression patterns, however often times I find that the gene of interest I am looking for to find coexpressed markers for are not exactly coexpressed... This is kind of a bad example of that, but I usually check this out using something like this (from here):
# Visualize co-expression of two features simultaneously
FeaturePlot(pbmc3k.final, features = c("MS4A1", "CD79A"), blend = TRUE)

Above, you can see there is co-expression between the two genes/markers (markers obtained through clustering)... My problem is for the gene I am interested in, the markers are usually in the same cluster, however those markers are not precisely in the same individual cells...
This is as far as I have gotten, as sort of a quick and dirty way to isolate cells that express the PDX1 gene and then look at other, I guess, top markers by just using rowSums and arranging from greatest to least...:
PDX1_expression = GetAssayData(object = my.human.scrnaseq.seurat.object,
                               assay = "RNA", slot = "data")["PDX1",]
pos_ids = names(which(PDX1_expression>0))
neg_ids = names(which(PDX1_expression==0))
pos_cells = subset(my.human.scrnaseq.seurat.object,cells=pos_ids)
neg_cells = subset(my.human.scrnaseq.seurat.object,cells=neg_ids)
FeaturePlot(pos_cells,"PDX1")
FeaturePlot(neg_cells,"PDX1")
pos = as.matrix(GetAssayData(object = pos_cells,
                             assay = "RNA", slot = "data"))


#below is where I think there could be improvements -specifically I don't think using rowSums is the best way...
sums <- as.data.frame(rowSums(pos))
colnames(sums) <- 'PDX1.coexpressed.genes'
sums<- sums %>% dplyr::arrange(desc(PDX1.coexpressed.genes))
head(sums)


PDX1.coexpressed.genes
MT-RNR2               205.6975
MT-CO3                194.1151
MT-CO1                191.6494
MT-CO2                176.7737
TMSB10                174.9517
RPLP1                 171.2465
Without getting roasted lol... Could I get some suggestions/ideas, please?
Thank you in advance.


I don't know about this particular sample but a situation like this could suggest that the identified clusters are somewhat more complex than they'd initially seem. Would it make sense to try to subcluster the upper-left cluster to see if the cells would separate and group better based on your genes of interest? Or maybe just increase the clustering resolution and possibly also modify UMAP parameters to give you better resolution there as well, such as
n.neighborsor number of dimensionsdims.Thank you for responding. You're right. I guess, I could do that.
I wish there was a more direct way to go about this (rather than sort of guessing and checking) - such as the way I was approaching it (specifically looking at the cells that only express "my favorite gene").
I have numerous datasets to do this for, so fine-tuning the parameters for each dataset, can fry my brain... temporarily lol (It sometimes gets exhausting)
Yea, it's quite a task, especially for some datasets that need a higher-level overview but then you need to zoom in on some clusters, so you have to optimize twice. It can also be computationally intensive and slow if you use clustering algorithms other than the default Louvain, such as Leiden. But good luck and I'd be curious if you can find a good way to separate the cells.