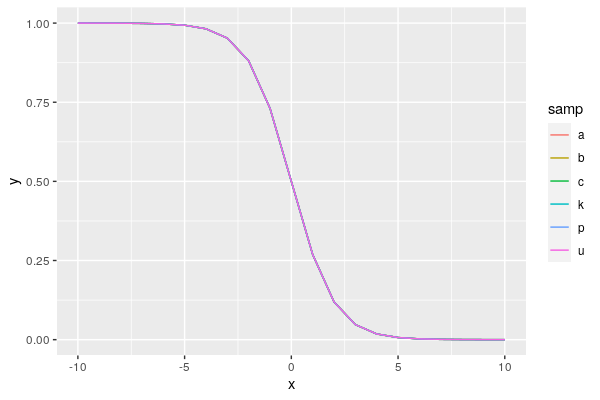
I am trying to plot in R my analyses, but in the plot I have overlapping lines.
How could I set an offset for the lines?
Thank you!
Here is my code and the plot:
mu <- 1.25e-8
gen <- 30
EA_S<-read.table("coal_output_E_S.final.txt", header=TRUE)
EA_WA<-read.table("coal_output_E_W.final.txt", header=TRUE)
S_CA<-read.table("cross_coal_S_CA.final.txt", header=TRUE)
S_WA<-read.table("cross_coal_S_WA.final.txt", header=TRUE)
WA_CA<-read.table("cross_coal_WA_CA.final.txt", header=TRUE)
EA_CA<-read.table("cross_coal_EA_CA.final.txt", header=TRUE)
plot(S_CA$left_time_boundary/mu*gen, 2 * S_CA$lambda_01 / (S_CA$lambda_00 + S_CA$lambda_11), xlim=c(1000,10000),ylim=c(0,1), type="n", xlab="Years ago", ylab="relative cross-coalescence rate")
lines(EA_S$left_time_boundary/mu*gen, 2 * EA_S$lambda_01 / (EA_S$lambda_00 + EA_S$lambda_11), type="s", col="red")
lines(S_CA$left_time_boundary/mu*gen, 2 * S_CA$lambda_01 / (S_CA$lambda_00 + S_CA$lambda_11), type="s", col="blue")
lines(S_WA$left_time_boundary/mu*gen, 2 * S_WA$lambda_01 / (S_WA$lambda_00 + S_WA$lambda_11), type="s", col="green")
lines(WA_CA$left_time_boundary/mu*gen, 2 * WA_CA$lambda_01 / (WA_CA$lambda_00 + WA_CA$lambda_11), type="s", col="grey")
lines(EA_CA$left_time_boundary/mu*gen, 2 * EA_CA$lambda_01 / (EA_CA$lambda_00 + EA_CA$lambda_11), type="s", col="orange")
lines(EA_WA$left_time_boundary/mu*gen, 2 * EA_WA$lambda_01 / (EA_WA$lambda_00 + EA_WA$lambda_11), type="s", col="violet")
legend("topright",legend=c("EA-S", "S-CA", "S-WA", "WA-CA", "EA-CA", "EA-WA"), col=c("red", "blue", "green", "grey", "orange", "violet"), lty=c(1,1))


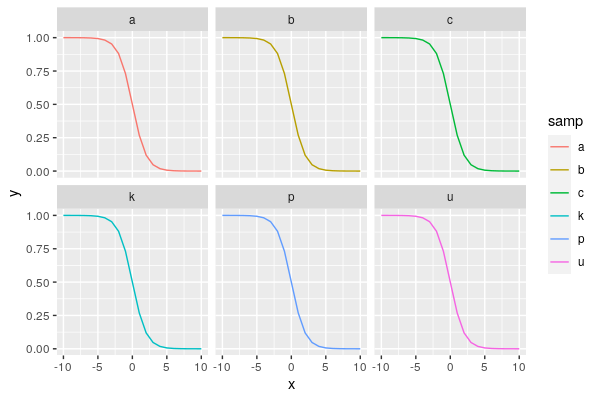
Possible ggplot2 solution using
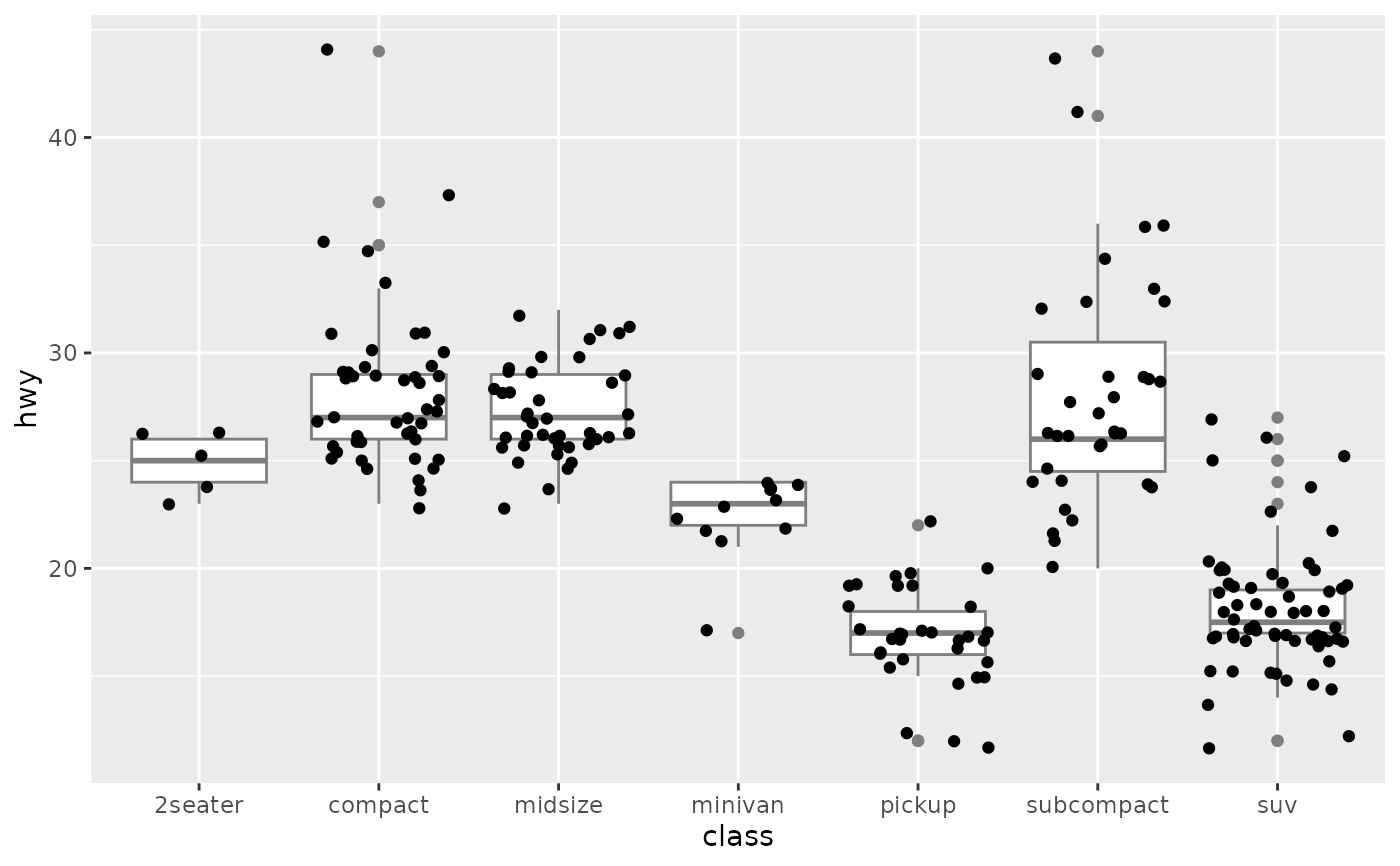
position_dodge:Fixing overplotting with lines is not straightforward. If possible, you might select a better way to get your point across. However, you could consider adding some custom jitter to the line values, as long as you make it absolutely clear that the values have been jittered for display purposes. There's no automatic way to set an offset, because this involves changing the data. If you're making a custom figure, and want to stick to the format above, you could consider adding custom annotations to indicate where overplotting is occurring (e.g. for one line, indicate all labels represented under that line). On the other hand, do you have to use lines? Can you use points instead? A jittered point approach might be easier to distinguish and explain.
Difficult to show so many overlapping lines, unless each sample is represented by individual line shapes and colors, but that would be confusing. You can try showing them in a different plane (3d).
Thank you all! Very helpful!