Entering edit mode
2.8 years ago
rohitsatyam102
▴
920
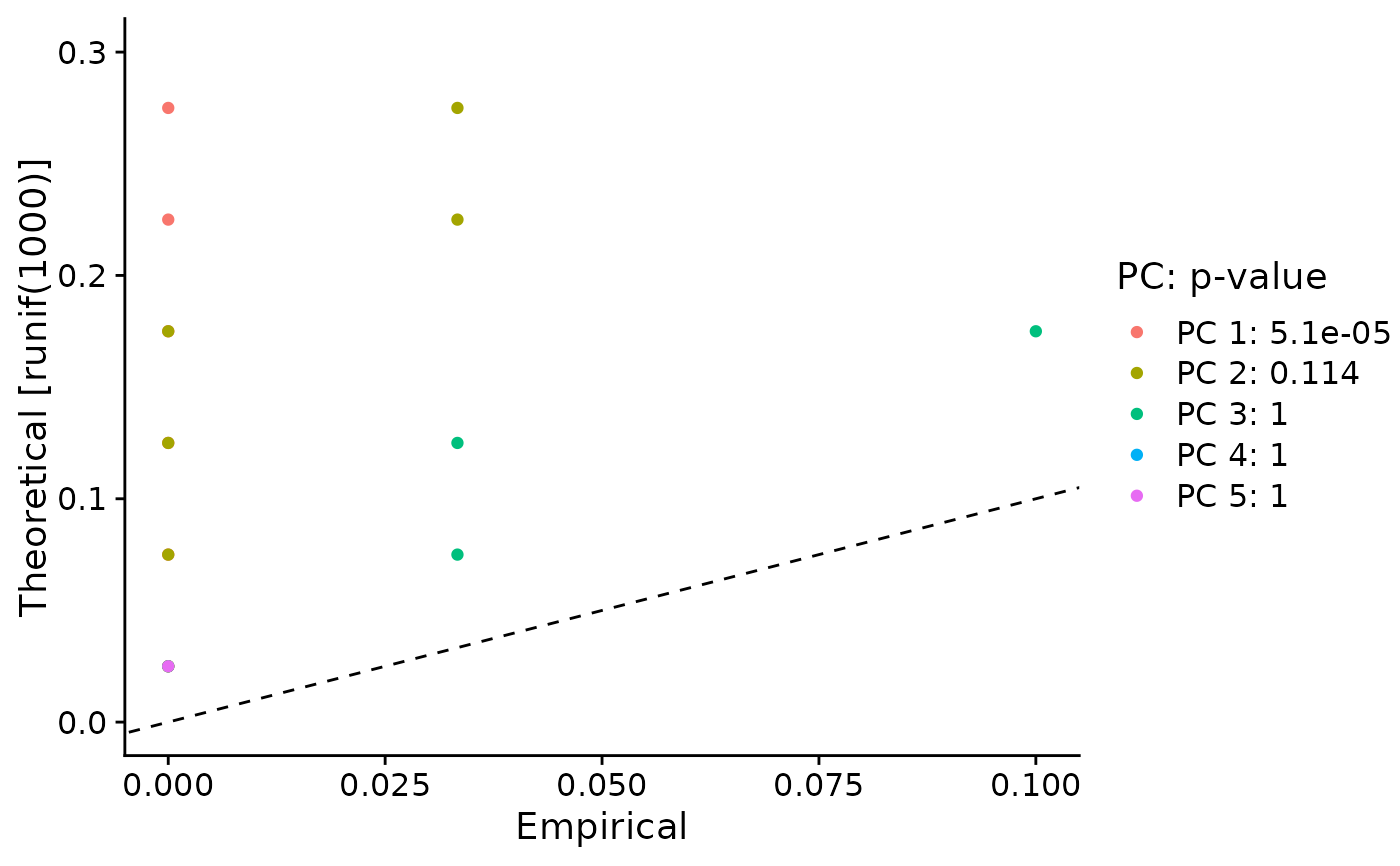
I am having a hard time understanding the Jackstraw plot and how it is made. A discussion on GitHub here and on StackExchange here give some insights but I still have a few questions:

- What does the axis of the Jackstraw plot represent. What is the meaning of
Theoretical [runif(1000)]andempirical. - What does the slope of the Jackstraw plot represents? What does each dot on that slope represent?
- Is there a detailed yet simplistic step by step explanation on how the P values are calculated starting from PCA loadings?

