Entering edit mode

6.2 years ago
Bhushan Dhamale
•
0
I have NRPS gene clusters isolated from running various bacterial genomes through antiSMASH. I need to generate a visualization of the gene clusters with color-coded annotation of their constituent genes as in the image in the link below. I have already gone through the methods in several papers but I was unable to find a description of how the image was generated. I have also tried various online gene cluster visualization programs, but they do not seem to fit my purpose. Could someone please point me to a program/package that would take gene clusters to generate an image similar to the one in the link below?
https://drive.google.com/file/d/1vP7pjst0Vz_utnLMHFsGWSwn64UfCB02/view?usp=sharing

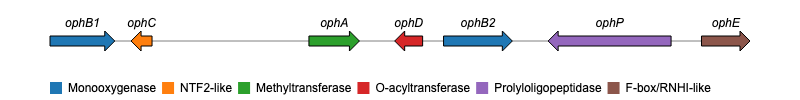
Adobe Illustrator, or any vector-based drawing tools, could do it. Just fit the pixels/arrow sizes to the gene scale in bp.