Forum:Exploring Amino Acid Patterns in Proteins Through N-gram Analysis
1
1
Entering edit mode
8 months ago
Anatoly A. ▴ 10

In our recent research, we delved into the amino acid composition of protein sequences by applying n-gram analysis techniques. By examining the distribution of n-grams ranging from 1-gram to 11-gram, we aimed to discern underlying patterns that could be indicative of structural or functional significance.

We started with an exploration of 1-grams to understand the basic composition of our protein dataset, followed by investigating the prevalence and distribution of larger n-grams. Our analysis included evaluating the fit of these distributions against well-known statistical laws—namely, Benford's, Pareto, and Zipf's.

An intriguing pattern emerged as n-gram lengths increased. The frequency distributions began to approximate Benford's Law more closely, particularly at tetragram and pentagram levels. Beyond pentagrams, the distributions deviated, suggesting a higher level of sequence diversity and complexity.

Furthermore, we assessed how these patterns aligned with the Pareto principle. While we found that the data did not strictly adhere to the "80/20 rule", there was an interesting variation in the concentration of occurrences across different n-gram lengths.

Our approach also involved identifying sequences with anomalies such as the presence of consecutive 'X' characters, which denotes unknown or unspecified amino acids, and sequences that were unusually short or long compared to the general protein population.

As we continue to dissect these patterns, several questions arise, inviting further scrutiny and discussion within the scientific community:

  • What biological insights can be inferred from the observed fit of amino acid patterns to Benford's Law, particularly for tetragrams and pentagrams?
  • How might the deviations in longer n-grams inform our understanding of protein complexity and functionality?
  • In what ways can the prevalence of specific n-grams guide the development of more accurate predictive models for protein function?
  • What are the implications of the identified sequence anomalies for data quality and sequence annotation in protein databases?

We are eager to engage with the bioinformatics community to explore these questions and welcome any insights or collaborative ideas that can drive this research forward.

Our public notebook Testing Pareto, Benford and Zipf

protein CAFA5 • 732 views
ADD COMMENT
3
Entering edit mode
8 months ago
Mensur Dlakic ★ 28k

Before moving forward with this, you should be aware that the dataset you used - it seems to be CAFA5 training data - is small and skewed toward larger proteins, and also towards higher eukaryotes.

This dataset has 142246 sequences with an average protein size of 553.6, while the average protein size in large datasets is 250-300 residues. You could try the same exercise with SwissProt:

wget https://ftp.uniprot.org/pub/databases/uniprot/current_release/knowledgebase/complete/uniprot_sprot.fasta.gz

It has about 4 times more proteins than your database (570830) but not quite 3 times the number of residues (206533160), which is to say that its average size is smaller (361.8). Better yet, you may wish to try a larger dataset such as UniRef50:

wget https://ftp.uniprot.org/pub/databases/uniprot/uniref/uniref50/uniref50.fasta.gz

I have UniRef50 from 2021, which has just over 50 million proteins and an average protein size of 282.9.

Below are Benford plots for the 2021 UniRef50 database, which are quite different from yours.

enter image description here

enter image description here

enter image description here

enter image description here

enter image description here

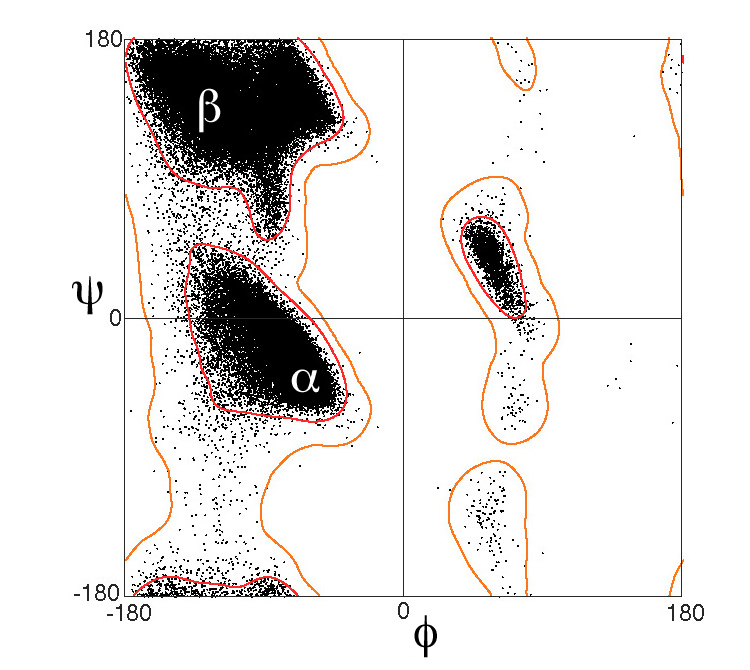
As to why the patterns emerge beyond the dipeptide level, it is because structural properties of proteins, such as secondary structure, are better defined when one takes some neighboring residues into account. We can see how the distribution of dihedral angles phi and psi relates to secondary structure elements in a Ramachandran plot below.

enter image description here

Another way to look at it is by low-dimensional embedding in self-organizing maps (SOMs), where one can see good but not perfect separation of secondary structure elements (H - helix, E - strand, C - everything else).

enter image description here

This is at a dipeptide level. If we extend it to a pentapeptide (which includes 1 kappa angle, 2 alpha angles, 4 phi and 4 psi angles), the CEH separation by SOMs gets better.

enter image description here

I suggest you get a larger database and go through existing literature as this has been researched before. I will get you started.

https://genomebiology.biomedcentral.com/articles/10.1186/gb-2007-8-3-r31

ADD COMMENT
0
Entering edit mode

Thank you professor, very insightful answer!

ADD REPLY

Login before adding your answer.

Traffic: 2457 users visited in the last hour
Help About
FAQ
Access RSS
API
Stats

Use of this site constitutes acceptance of our User Agreement and Privacy Policy.

Powered by the version 2.3.6