
Hello everyone,
I’m a newbie to bioinformatics and I’m trying to extract Differentially Expressed Genes (DEGs) from the GEO database for my research. I’ve tried following some papers, but I’m having trouble replicating exactly the number of DEGs that they get in their results , and I’m not sure where I’m going wrong.
Here’s what I’ve done so far in a publication:
Maharjan, M., Tanvir, R.B., Chowdhury, K., Duan, W. and Mondal, A.M., 2020. Computational identification of biomarker genes for lung cancer considering treatment and non-treatment studies. BMC bioinformatics, 21, pp.1-19.
And these are what the paper mention in the methods:
"In study GDS1204, the lung cancer cell line, A549, is treated with chemotherapeutic drug motexafin gadolinium (MGd). Three samples are examined at 4, 12, and 24 h following treatment, thus the study consists of 9 control and 9 case samples. In study GDS2499, A549 lung cancer cell lines are treated with two doses of anti-cancer agent sapphyrin PCI-2050 and one dose of transcription inhibitor actinomycin D. The controls are prepared by treating A549 cell lines with mannitol. In each experiment 3 samples are used. This study will provide two sets of DEGs – a) By comparing two doses (applied to 3 samples for each dose, a total of 6 cases) of anti-cancer agent sapphyrin PCI-2050 with 3 control samples; b) By comparing 3 samples with one dose of actinomycin D with 3 control samples."
"After identifying the non-treatment and treatment studies, GEO2R, a LIMMA R package in GEO database, was used to isolate top 250 DEGs from each study. The cutoff criteria used were P-value < 0.05 and absolute log2 Fold Change (FC) > 1. Benjamini & Hochberg (False Discovery Rate) method was used for adjusting P-values. The duplicate DEGs and DEGs with missing symbols were removed from the top 250 DEGs. Finally, a total of 407 DEGs (254 upregulated and 153 downregulated) were discovered from non-treatment studies. Similarly, a total of 547 DEGs (133 upregulated and 414 downregulated) were discovered from treatment studies. There is no common DEGs between non-treatment and treatment studies."
And these are what I have done:
As information in the publication above, the treatment group should have 3 DEGs set including 1 from GDS1204 (GSE2189) and 2 from GDS2499 (GSE6400). Then I have done:
Firstly, I analysed GDS1204 (GSE2189) using GEO2R in the Options Tab with Significance level cut-off were P-value < 0.05 and absolute log2 Fold Change (FC) > 1. Benjamini & Hochberg (False Discovery Rate) method was used for adjusting P-values for 1 comparison (9 control vs 9 case sample).
Then, I download them then run in excel. I used Filter in excel then I got a DEGs set with only 12 meaningful DEGs (with adj. P value <0.05, logFC >1 or logFC<-1).
Secondly, I analysed GDS2499 (GSE6400) using GEO2R in the Options Tab with the same settings for 2 comparisons (control vs sapphyrin PCI-2050 and control vs actinomycin D)
After that, I download them then run in excel. I used Filter in excel then I got 2 DEGs set over 1000 and over 2000 meaningful DEGs (with adj. P value <0.05, logFC >1 or logFC<-1) for sapphyrin PCI-2050 and actinomycin D respectively. Then I use Remove duplication for the column of Gene Symbol in excell for those DEGs set to get top 250 DEGs.
The publication mention that they got 547 DEGs (133 upregulated and 414 downregulated) were discovered from treatment studies.
Finally, I am unsure if I am missing something important. Since I’m still learning, I would really appreciate it if someone could guide me through the process step-by-step or help me figure out where I might have made a mistake.
I’m specifically looking for advice on:
How to properly preprocess the data before DEG analysis.
How to correctly set up the design matrix and contrasts.
Is there any simple process (for people with no background in coding) to extract DEGs?
Thanks a lot for your time and help!
You are not likely not going to recreate the analysis analysis described in the paper using GEO2R. That interface is more of a convenience than a rigorous analysis tool. You should have been able to obtain the top differentially expressed genes using GEO2R, even though the number you got did not match what is published in the paper. Did you check on that?
What do you mean by this? From the papers you already know the gene ID's which are differentially expressed.
Thank you for your response! I appreciate your insights.
I did try extracting the top DEGs using many way including only GEO2R or GEO2R combining manual tools with the same filtering criteria as the publication (Padj < 0.05, absolute log2 Fold Change > 1). However, I cannot recreate the number of DEGs as in the paper.
For example, for treatment group: I could only extract 12 meaningful DEGs which satifies the Padj < 0.05, absolute log2 Fold Change >1 from GDS1204 (GSE2189). So even with maximum of 250 DEGs (even without duplicate DEGs and DEGs with missing symbols) from 2 each DEGs set of the remaining dataset (GDS2499 (GSE6400)), I could not get the exact final 547 DEGs as stated in the paper.
I really dont know where I got wrong or I dont know what exactly they did to get the similar number of DEGs.
I just simply want to express that I want to extract DEGs from a specific GEO dataset and I am learning to do it by following the previous publications. But now I am stuck and cannot recreate the results from them.
Thank you so much for your time and your help!
(This is a result the I got)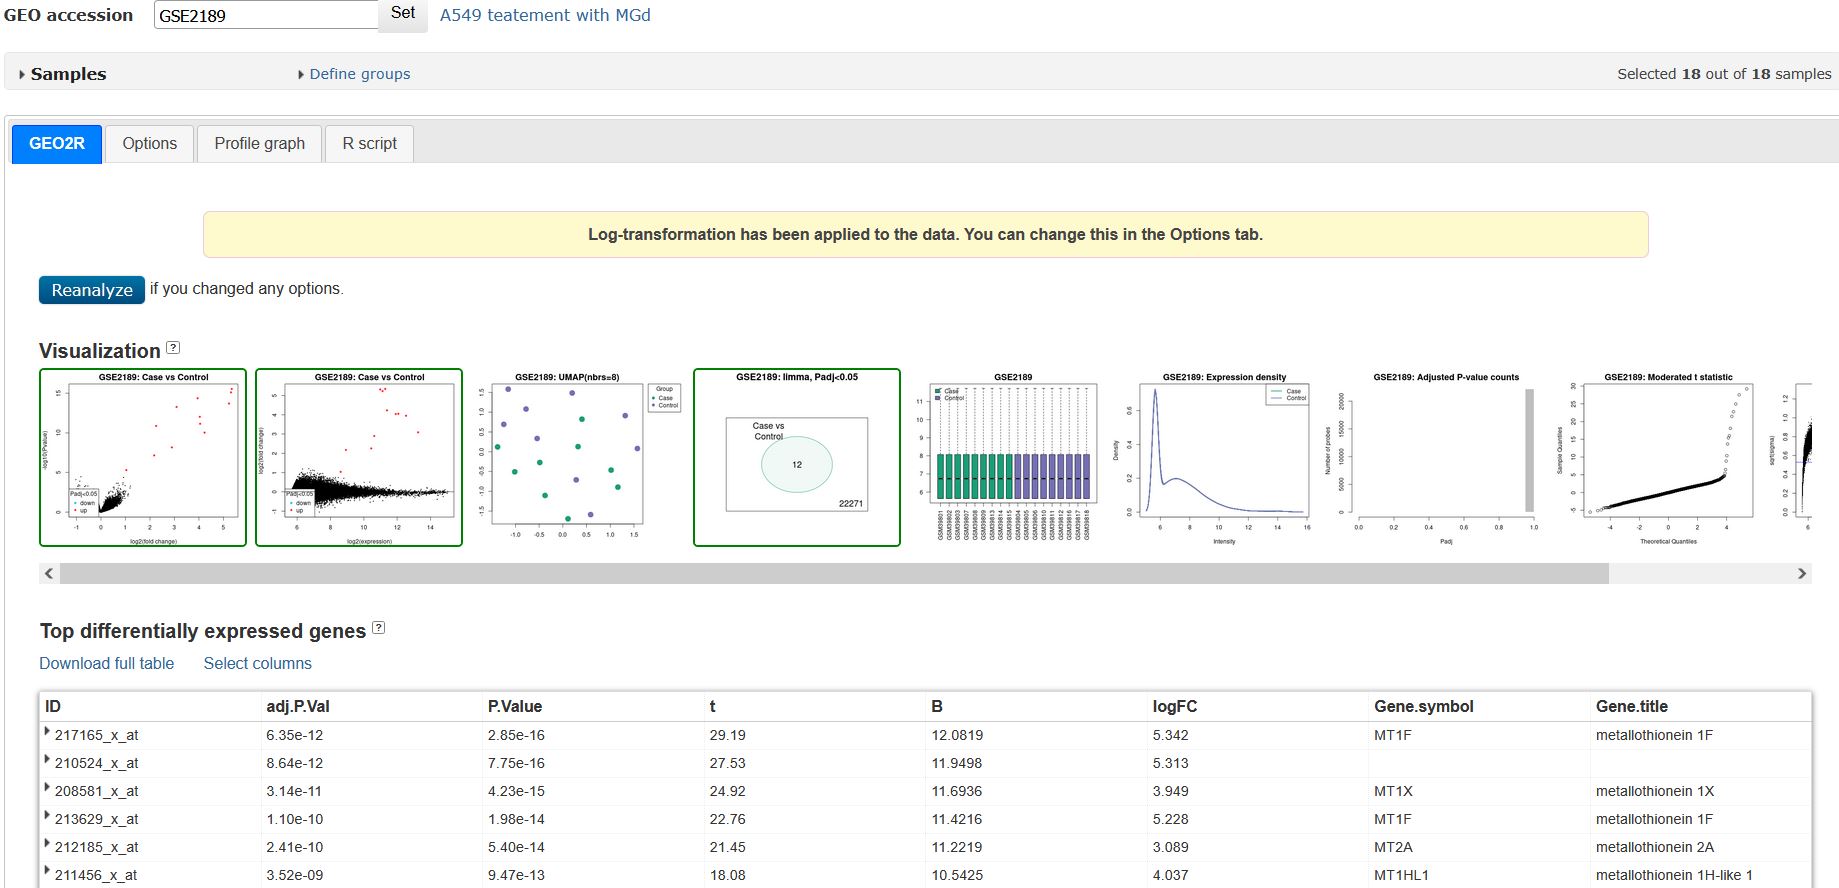
and these are step that I have done:
Such is life/science. Reproducibility of results is an ongoing challenge in bioinformatics. Unless you are exactly following the analytical procedure (program versions/steps etc) it may be difficult to recreate the exact result. Which is one of the reasons people are working on self contained containers that can include data and all the software so anyone can reproduce the results at a later date. While it will sound unpleasant, a possibility exists that the the published paper has an error in their analysis.
Thanks so much for your explanation.
I'm still pretty new to bioinformatics, and sometimes I struggle to understand some of the more complex aspects of the field—like the challenges with reproducibility and the possibility that a published paper might contain an error.
Your explanation really helped clear up my confusion, and I truly appreciate your help!